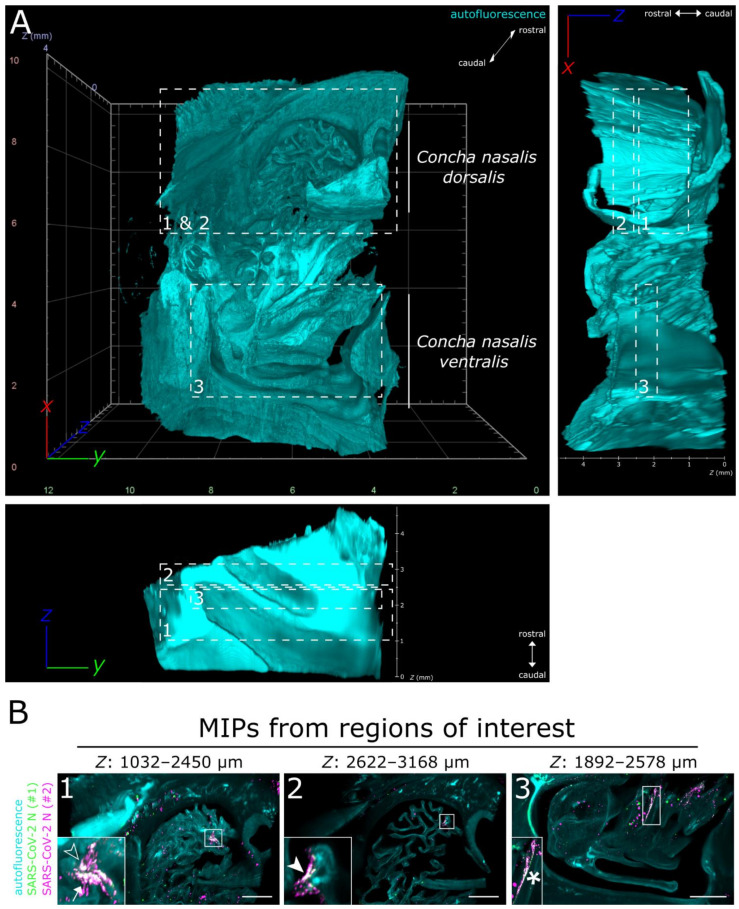
Figure 2.
LSFM is able to visualize SARS-CoV-2 infection in nasal turbinates within a high spatial context. (A) The tissue structure of the nasal conchae (>200 mm3; 4 days post-infection) was reconstructed using tissue autofluorescence (cyan) and is depicted as volumetric projection from three viewing angles. Anatomical terms of location are provided for orientation. Edge length of grid squares = 2 mm. Total magnification = 1.26×. (B) Maximum intensity projections (MIPs) of the regions of interest (1–3) highlighted in (A). SARS-CoV-2 infection is characterized by colocalization of both SARS-CoV-2 N stainings (#1, green; #2, magenta) and results in white coloring (inset). Four distinct SARS-CoV-2 infection foci are highlighted (filled-in arrowhead [A1], outlined arrowhead [A5], arrow [A7], and asterisk). Foci will hereafter be referred to via their respective indicator or designation in square brackets. Ranges of the MIPs in the z-dimension are provided above the respective image. Scale bar = 1 mm.

