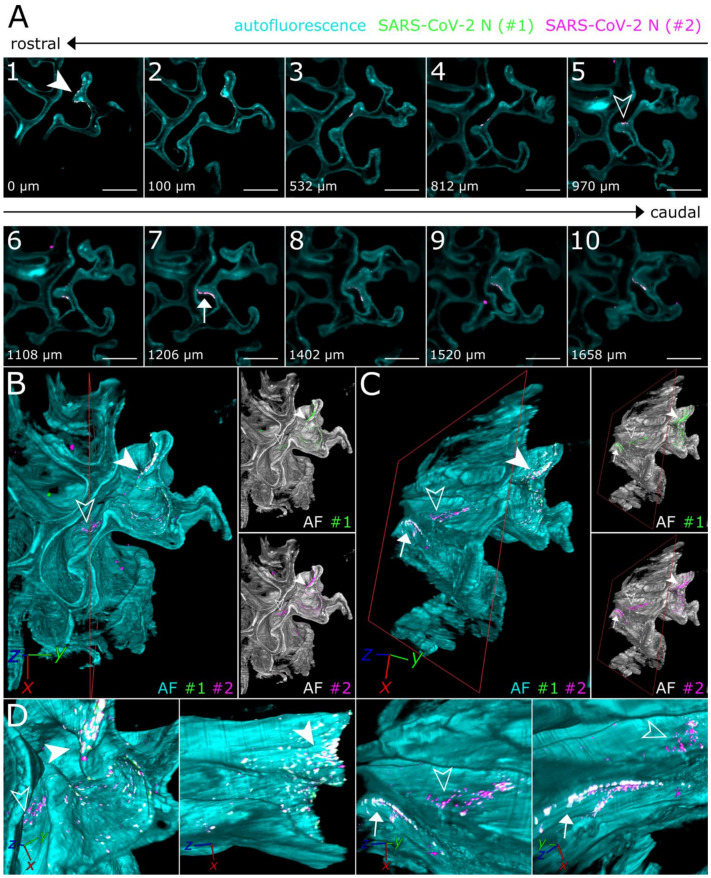
Figure 3.
3D detail views highlight oligofocal SARS-CoV-2 infection pattern in nasal turbinates at 4 days post-infection. (A) Tomographic representation of three individual SARS-CoV-2 foci (filled-in arrowhead [A1], outlined arrowhead [A5], and arrow [A7]) from ROIs 1 and 2 in Figure 2 along a length of 1658 µm. The relative distance to plane #1 is indicated in the bottom left corner. For additional detail views of the SARS-CoV-2 infection foci A1, A5, and A7, refer to Figure S2. Cyan = autofluorescence; green = SARS-CoV-2 N #1; magenta = SARS-CoV-2 N #2. Scale bar = 400 µm. Total magnification = 8×. (B,C) Volumetric projections of the detail view from two angles. Clipping at the indicated plane (red) reveals the third SARS-CoV-2 foci (C) (arrow), which is hidden behind nasal turbinate tissue in (B). Single-channel views further emphasize the colocalizing pattern of both SARS-CoV-2 N stainings (#1, green; #2, magenta). Cyan/grayscale = autofluorescence (AF). (D) Close-ups of the three individual infection foci. The angle of the respective image is indicated in the bottom left corner. For single-channel projections, refer to Figure S2.

