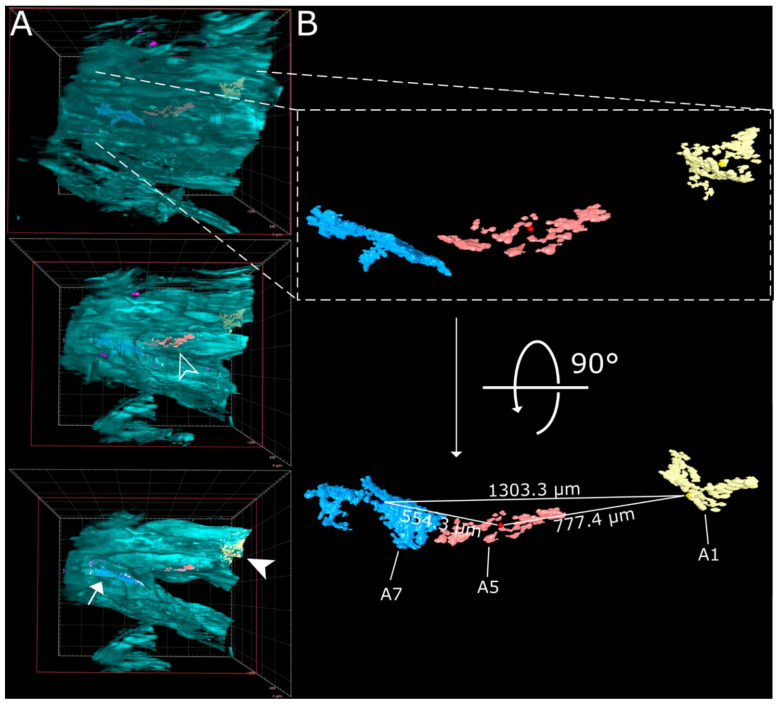
Figure 4.
Virtual segmentation of SARS-CoV-2 infection foci at 4 days post-infection. (A) xz-view of the magnified nasal turbinate view from Figure 3, clipped at the indicated plane (red square). Segmented SARS-CoV-2 infection foci (A1: yellow, A5: red; A7: light blue) are visible through the autofluorescence reconstruction of the tissue morphology (cyan). Once they are uncovered by the clipping plane, they are highlighted with their respective indicator. (B) Detail and alternate viewing angle of segmented infection foci. A slightly darker sphere represents the respective foci center. The direct linear distances between the centers of each foci (from Table 1) are highlighted.

