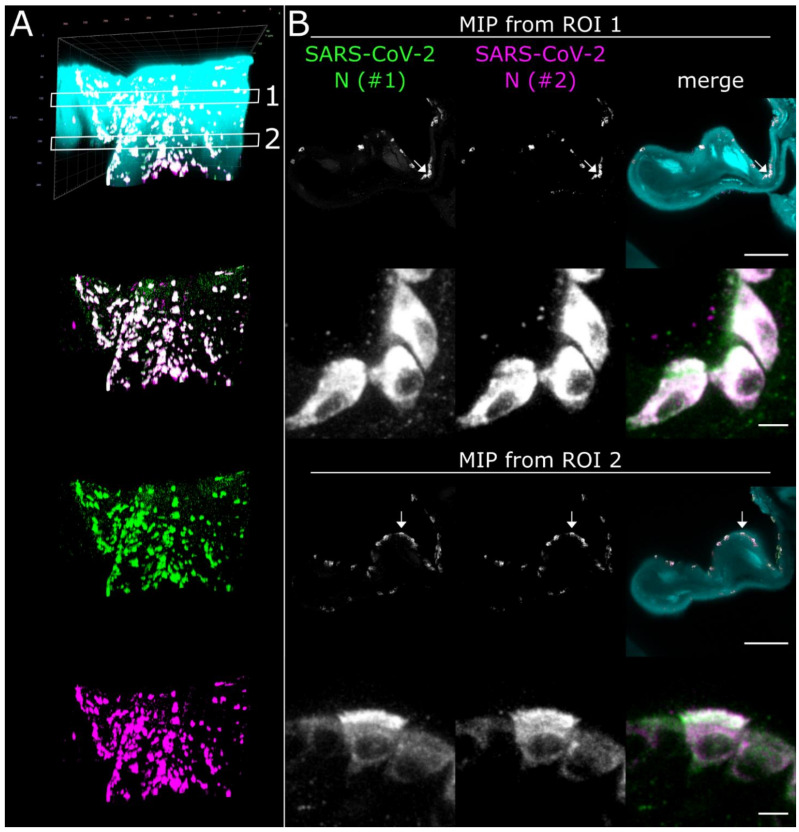
Figure 5.
High-resolution CLSM analysis of SARS-CoV-2 infection foci in the Concha nasalis dorsalis of a SARS-CoV-2-infected ferret at 4 days post-infection. (A) 3D maximum intensity projection (MIP) of a SARS-CoV-2 infection focus from ROI 1 in Figure 2. The image stack was acquired with a 40×/1.1 water immersion objective. Cyan = autofluorescence; green = SARS-CoV-2 N #1; magenta = SARS-CoV-2 N #2. Edge length of grid square = 40 µm. (B) MIPs from ROIs 1 and 2 in (A). Individual cells can be analyzed at subcellular resolution, highlighting infection of ciliated and non-ciliated cells (arrows). For z-stack analysis of ROI 2, refer to Figure S3. Scale bar = 100 µm (overview) and 5 µm (detail).

