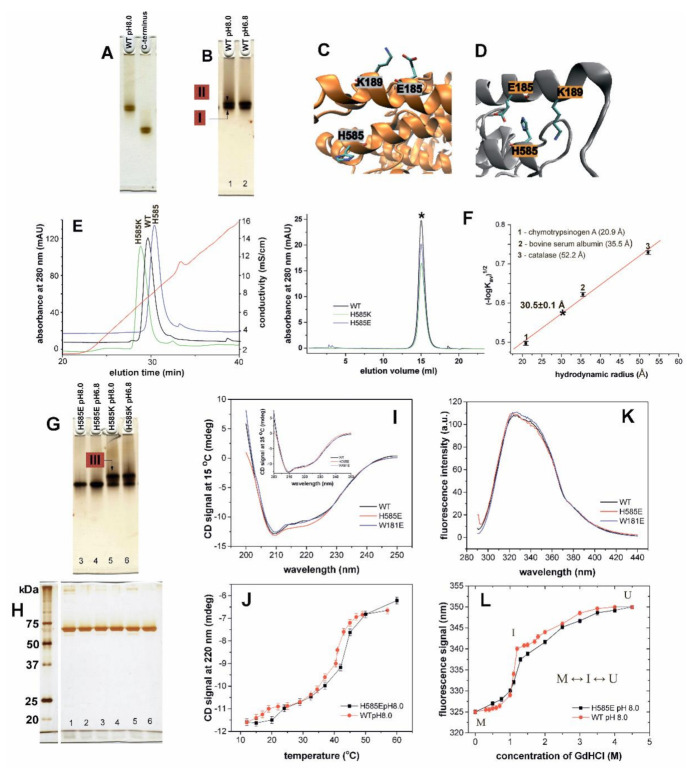
Figure 2.
Structural characterization of wild-type and mutant rabbit ALOX15. (A) Native PAGE electrophoresis of rabbit ALOX15 and its catalytic domain. (B) Effect of pH on structural heterogeneity of ALOX15. At pH 8.0 the two conformers (red labelled enzyme pools I and II) are better resolved when compared with pH 6.8. (C) Crystal structure of conformer A (no ligand at the active site). In this structure the side chain of His585 (H585) is localized on the protein surface and is accessible to the solvent. (D) Crystal structure of conformer B (ligand bound at the active site). Here the side chain of His585 (H585) is buried inside the protein between the side chains of Glu185 (E585) and Lys189 (K189). It is shielded from the solvent. (E) Elution order of the purified ALOX15 variants from the Resource Q (6 mL) column in anion exchange chromatography using a linear NaCl gradient. Absorbance of the column effluent at 280 nm (green, black, blue) and conductivity (red curve) were simultaneously recorded. (F) Size exclusion chromatography (left panel) of the purified recombinant proteins was carried in 20 mM Tris-HCl buffer and we estimated their hydrodynamic radii using different calibration proteins (right panel). The elution volume of the wild-type ALOX15 and the mutants is labelled with asterisk. (G) Native PAGE of rabbit ALOX15 mutants was performed at two different pH as described above for the wild-type ALOX15. (H) SDS-PAGE of the enzyme preparations (the numbers correspond to the protein samples that are present on panels B and G). (I) CD spectra of wild-type and mutant rabbit ALOX15. (J) Thermal stability of wild-type rabbit ALOX15 and its His585Glu (H585E) mutant. The relative intensity of the CD signal of ALOX solution was measured at 220 nm at different temperatures. (K) Fluorescence spectra of wild-type and mutant rabbit ALOX15. (L) The shift of the maximum of the fluorescence spectrum in the presence of different concentrations of GdnHCl was monitored by fluorescence steady state spectroscopy for wild-type rabbit ALOX15 and its His585Glu (H585E) mutant. The GdnHCl denaturation curves follow a 3-state transition model (ground state M ↔ intermediate sate I ↔ unfolded state U).

