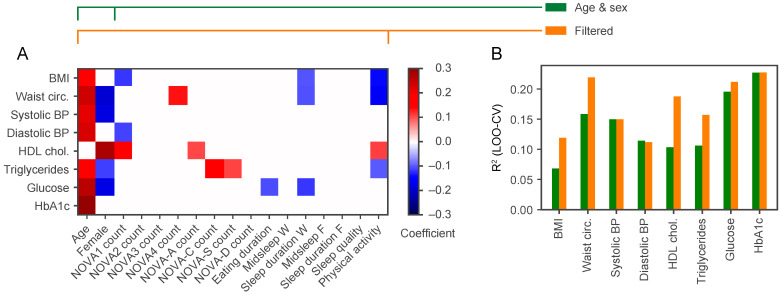
Figure 2.
The addition of NOVA categories and physical activity to age and sex increases the predictive power for MS components. (A) Each row shows the regression coefficients for predicting the clinical variable (labelled on the y-axis) using the explanatory variables (labelled on the x-axis), all measured in the observation phase. BMI, body mass index; BP, blood pressure; HbA1c, glycated haemoglobin; HDL chol., high-density lipoprotein cholesterol; NOVA count, the number of ingestion events of each NOVA category; NOVA-A, alcohol-containing drinks; NOVA-C, caffeinated drinks; NOVA-S, sweet drinks; NOVA-D, other drinks; Midsleep W and Midsleep F, the midpoint of sleep on workdays and free days, respectively; Sleep duration W and Sleep duration F, the sleep duration on workdays and free days, respectively; Waist circ., waist circumference. The regression coefficients show the mean posterior parameter estimate, and variables that are not significant are shown as white space. The red colour corresponds to a positive coefficient, and the blue colour a negative coefficient. (B) Bar heights represent the R2 values calculated on test participants using leave-one-out cross-validation (LOO-CV) to compare the predictive performance of a model that uses only age and sex (green bars) versus a model that uses all variables that were significant (orange bars, selected variables in panel (A)).

