Figure 3.
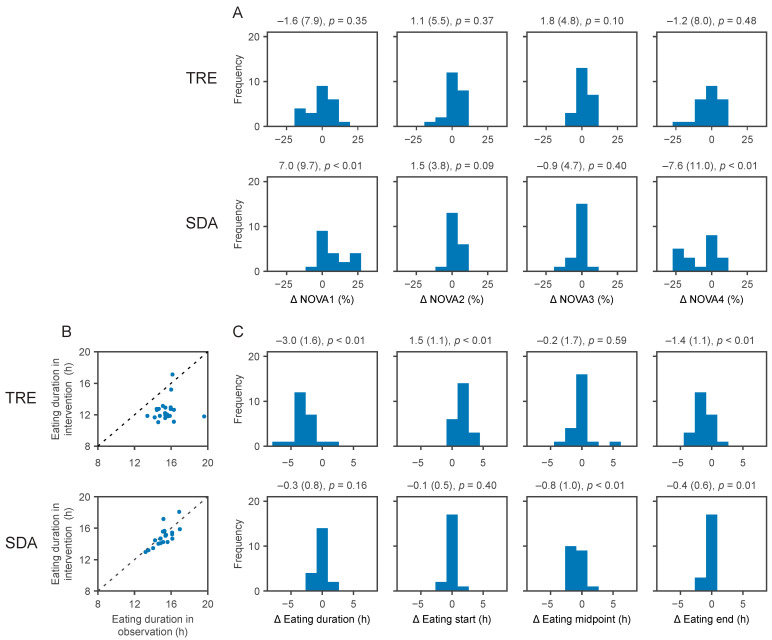
Changes in the consumption of NOVA categories and in eating duration with the TRE and SDA interventions. During the 6 month intervention phase, the changes in consumption of NOVA categories (panel (A)) and in eating duration (panels (B,C)) showed compliance with time-restricted eating (TRE) and standard dietary advice (SDA) interventions. Numbers above each histogram represent the changes (unit on the x-axis) as mean (standard deviation) and p-value. (A) From left to right: Changes (x-axis) in the proportion of unprocessed or minimally processed foods (NOVA1), processed culinary ingredients (NOVA2), processed foods (NOVA3), and ultra-processed foods (NOVA4), depicted as % of all classified ingestion events and the number of participants per bin is shown on the y-axis. (B) Scatter plot of eating duration during the observation and the intervention phases with TRE (top) and SDA (bottom). The dashed line represents an absence of change in eating duration between both study phases. (C) From left to right: Changes (x-axis) in eating duration, the start of the eating interval, the midpoint (median) of the eating interval, and the end of the eating interval compared to the observation phase, in fractional hours (i.e., 1.33 h = 1 h and 20 min). A shift to the left means a shorter eating duration, an earlier start, an earlier midpoint, and an earlier end of the eating interval, respectively. A shift to the right means a longer eating duration, a later start, a later midpoint, and a later end of the eating interval, respectively.

