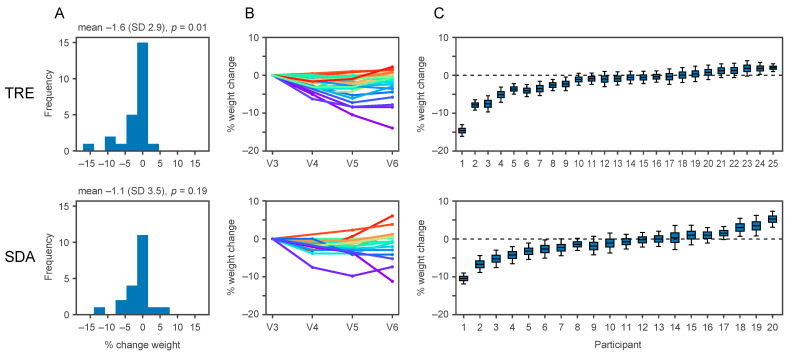
Figure 4.
TRE alters body weight. (A) Change in body weight after time-restricted eating (TRE, top) compared to standard dietary advice (SDA, bottom). Data are presented as histograms of weight change (in % of initial body weight). Numbers above the histograms represent the weight change as mean (standard deviation) and p-value. (B) Recorded weight measurements for each participant across multiple visits expressed as a percentage change relative to initial body weight. V3, randomisation visit; V4, interim visit 2 months post-randomisation; V5, interim visit 4 months post-randomisation; V6, closeout visit. (C) For each individual (x-axis), the weight change (in % of initial body weight) was estimated using all recorded weight measurements and a quadratic regression model. The boxes show the 25th, 50th, and 75th percentiles of estimated weight change, and the whiskers show the 5th and 95th percentiles.

