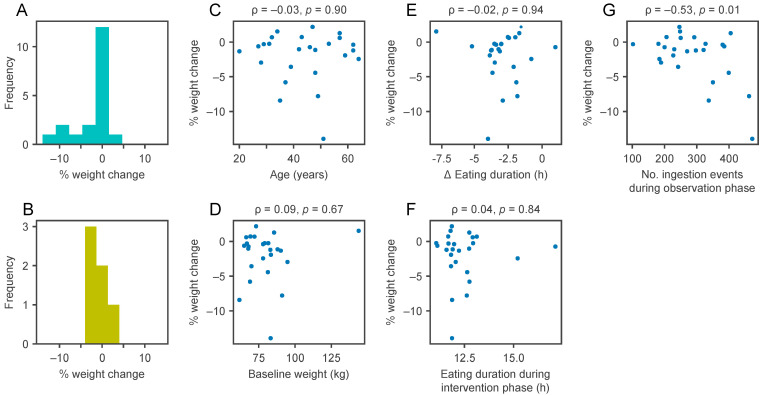
Figure 5.
The number of items recorded in the observation phase correlates with weight loss. Exploration of potential explanatory parameters for more weight loss in the time-restricted eating (TRE) group: Subgroup analysis by sex (panel (A): women; panel (B): men, p-value for comparison = 0.57); panel (C): weight change relative to age; panel (D): weight at baseline; panel (E): eating duration change between study phases; panel (F): eating duration during the intervention phase; panel (G): the number of ingestion events recorded during the observation phase (after pre-processing of data as detailed in Section 2.3). Numbers above the scatter plots represent the Pearson correlation coefficient (Greek letter ρ) and the p-value.

