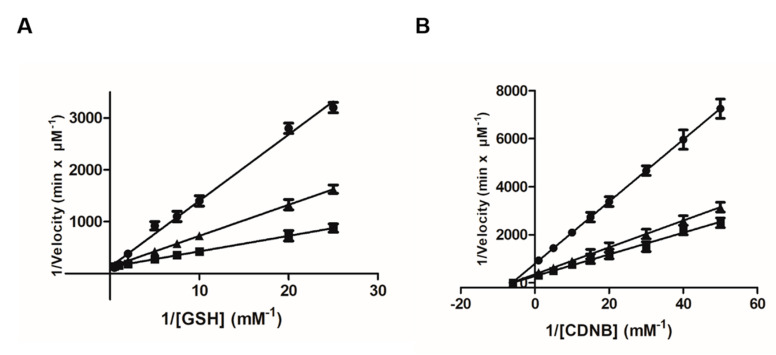
Figure 3.
Lineweaver–Burk plots for the inhibition of hGSTA1-1 by fisetin. (A) Inhibition of hGSTA1-1 by fisetin [(0 μM (■), 0.5 μM (▲), 2.5 μM (●)] using the concentration of the CDNB constant, and the concentration of GSH was varied (0.04–2.0 mM). (Β) Inhibition of hGSTA1-1 by fisetin [(0 μM (■), 1 μM (▲), 3.5 μM (●)] using the concentration of GSH constant, and the concentration of CDNB was varied (0.0375–0.675 mM).

