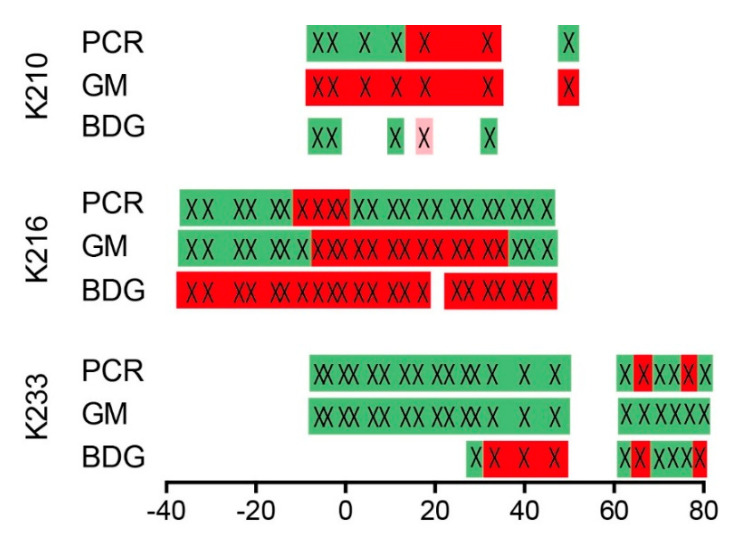
Figure 2.
Temporal correlation of positive biomarkers (PCR, GM and BDG) in probable IA patients. The scale represents days in correlation to positive high resolution computed tomography (HRCT) scan; positive tests are indicated by crosses on red background. Green background indicates negative tests. Light red background (K210, BDG) indicates a serum with an indeterminate BDG result: 60–79 pg/mL; negative numbers indicate time before HRCT.

