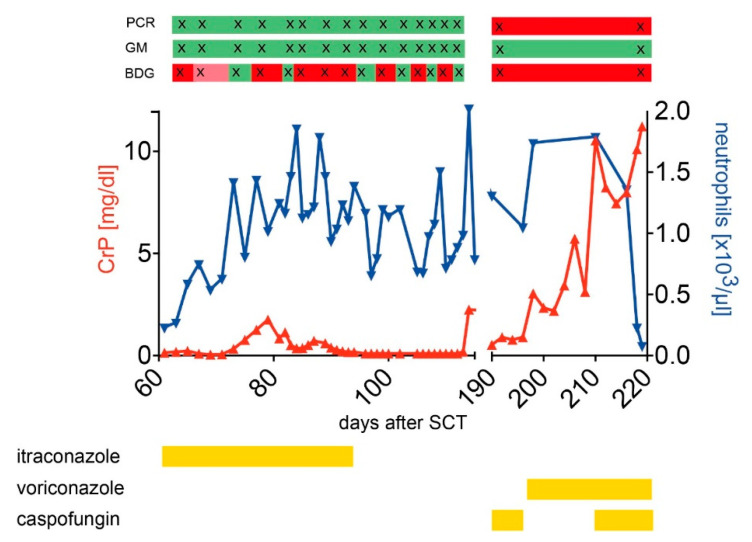
Figure 3.
Medical history of a patient with several suspected pulmonary infections. Graph displays the course of C-reactive protein (CrP, red) and neutrophils counts (blue) over time, together with the results of the GM, PCR, and BDG assays (bars above the graph). For GM, PCR, and BDG assays, “red” indicates a positive test result, “green” a negative test result, “light red” an indeterminate result (only for BDG). Antifungal prophylaxis/treatment is outlined in yellow bars below the graph.

