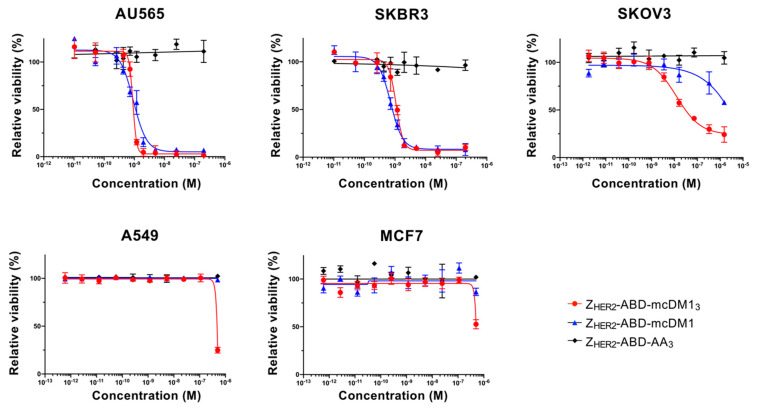
Figure 4.
The conjugates’ cytotoxic potential in vitro. The cell lines’ relative viability was determined and plotted against the concentration of the added AffiDCs or the non-toxic control. The half maximal inhibitory concentration (IC50) values were determined from the plots when the cells’ relative viability was 50% that of the untreated cells (which was set to 100%). Each concentration was tested in quadruplicate wells, and the mean value is plotted with error bars corresponding to 1 standard deviation (SD).

