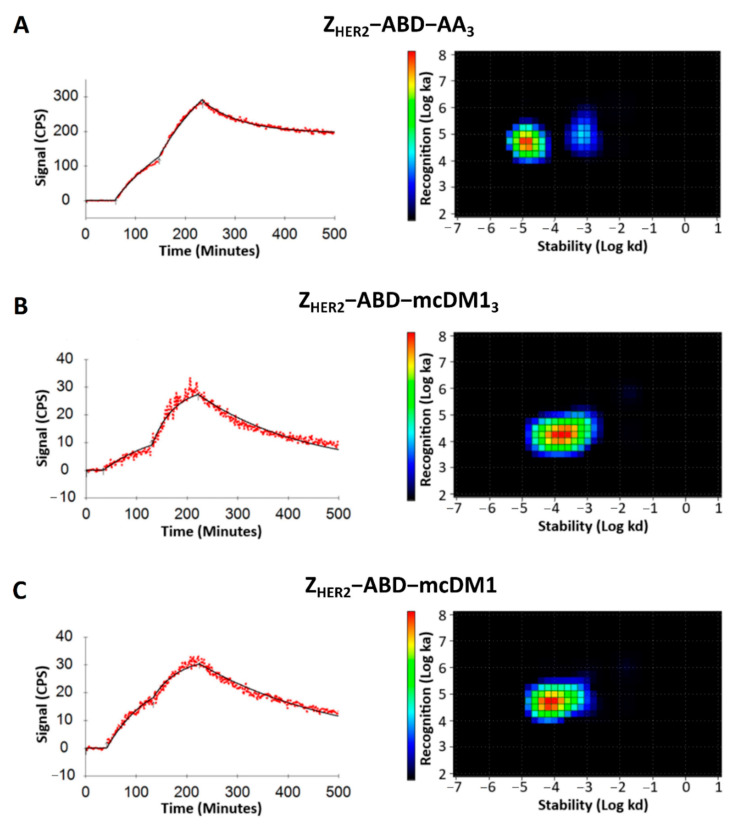
Figure 6.
Real-time binding data and interaction map analysis of (A) ZHER2–ABD–AA3, (B) ZHER2–ABD–mcDM13, and (C) ZHER2–ABD–mcDM1 to SKOV3 cells. For the real-time binding analyses to the left in each panel, the cells were incubated with the conjugates at a concentration of 1 nM for 90 min, followed by 2 nM for 90 min to record data for the association phase. At 220 min, the conjugates were removed to record data for the dissociation phase. The interaction maps were derived from the real-time binding analyses and are shown to the right in each panel, with the logarithm of the dissociation rate on the x-axis and the logarithm of the association rate on the y-axis.

