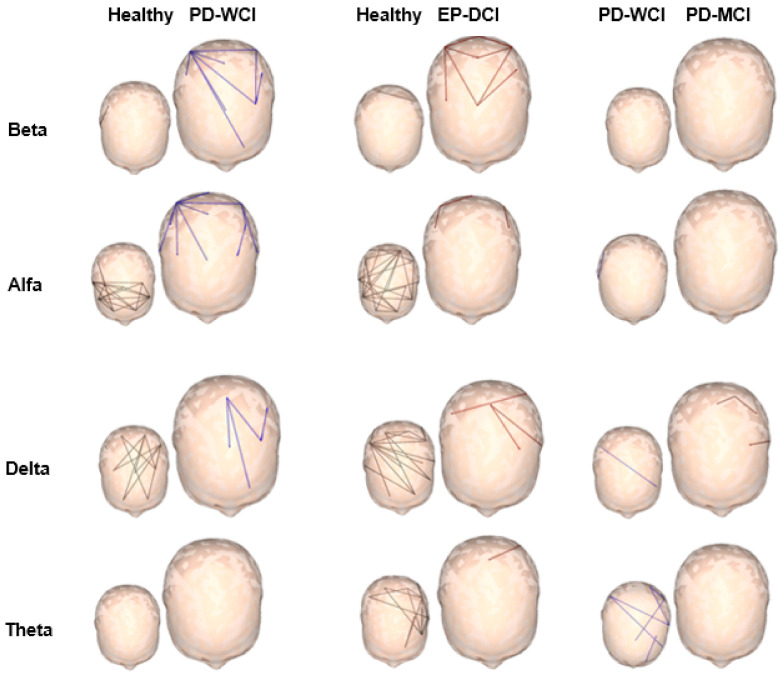
Figure 1.
Significant connections between electrode pairs for each EEG frequency (alpha, beta, theta, and delta). The different colors represent the significance values p < 0.05 of the permutations test used for each of the groups studied: healthy subjects in black, patients without cognitive impairment (PD-WCI) in blue, and patients with mild cognitive impairment (PD-MCI) in red. In the skull-shaped figures, the largest size does not represent statistical differences, it is used to highlight the result of the group of greatest interest according to the objectives of the investigation.

