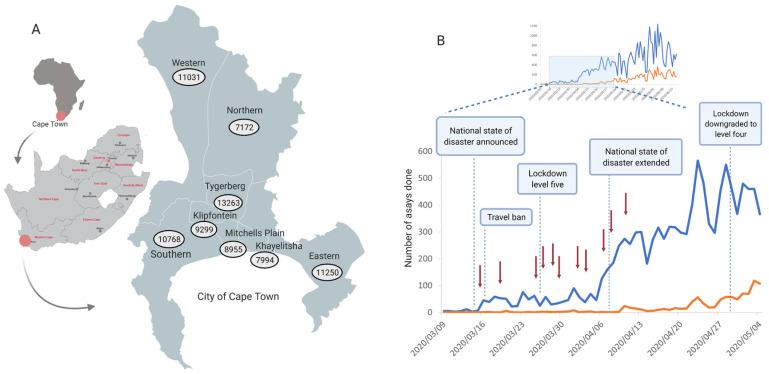
Figure 1.
Epidemiology of SARS-CoV-2 in the Western Cape and the City of Cape Town. (A) Map of South Africa indicating the different provinces with a map of cases in the Cape Town Metropole on 31 July 2020 in the eight different health subdistricts. Data were obtained from the Western Cape Provincial Government, https://coronavirus.westerncape.gov.za, last accessed 21 March 2021. (B) Graphical presentation of the number of SARS-CoV-2 assays carried out and the number of positive cases at the Virology Division, NHLS, Tygerberg. The detailed view from 9 March 2020 indicates the timeline of the government response to the epidemic, with red arrows indicating early sample collection for sequencing at Tygerberg Hospital. Figure created using BioRender (https://biorender.com, last accessed 21 March 2021).

