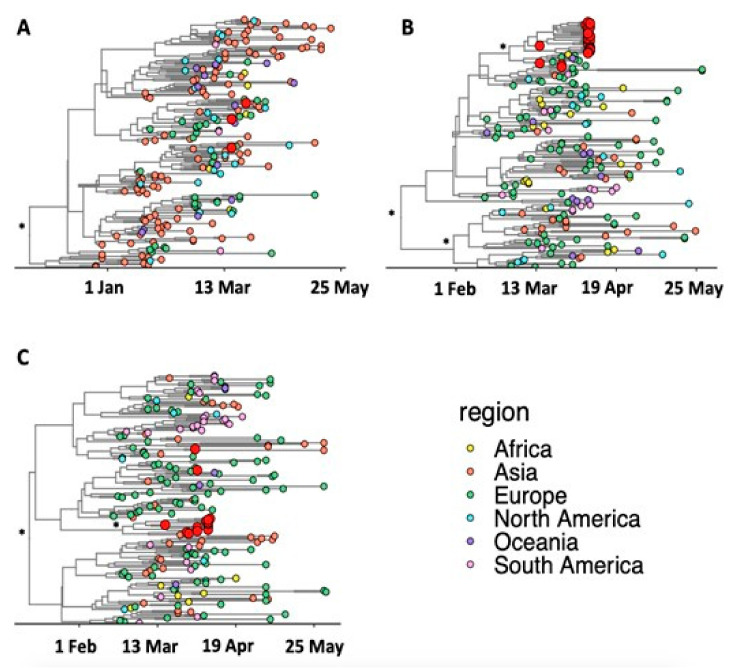
Figure 4.
Bayesian Maximum Clade Credibility trees of major SARS-CoV-2 clades. (A) Clade 19A, (B) Clade 20 A and (C) Clade 20B. The sequences are colored according to their region of sampling, while Cape Town sequences are labelled in red. The branches of the tree topology are in calendar time while well-supported splits in the tree topology (posterior support > 0.9) are marked with an asterisk (*).

