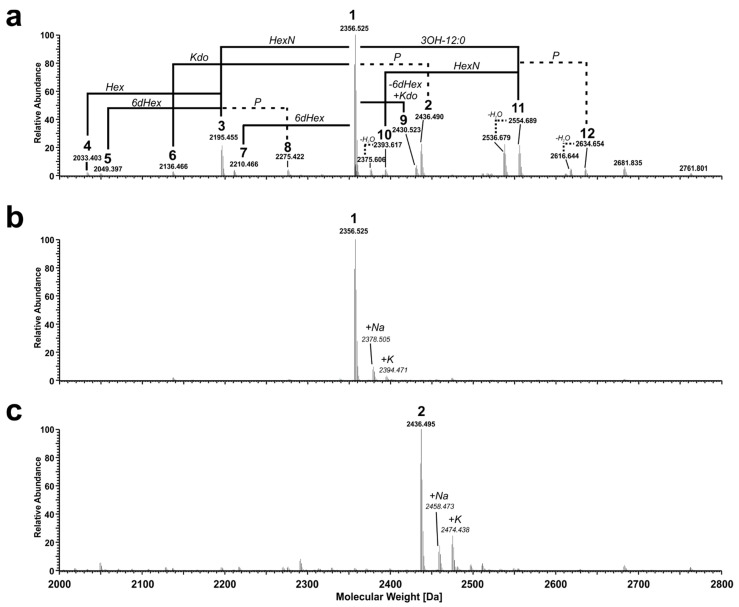
Figure 3.
Mass spectrometric analysis of the O- and N-deacylated core-LA carbohydrate backbone of Pst DC3000 ΔwbpL. (a) Molecular species distribution in the mixture of oligosaccharides obtained after hydrazinolysis and alkaline hydrolysis (OS-HyKOH). The charge-deconvoluted spectrum of the MS-analysis performed in negative ion mode is depicted; the observed molecular species are listed in Table 2. MS-spectra of selected pools from the further fractionation by HPAEC containing molecules 1 (b) and 2 (c), respectively. Molecular masses given in italic style represent sodium (Δm = 21.98 Da) or potassium (Δm = 37.95 Da) adduct ions of the respective base peak.

