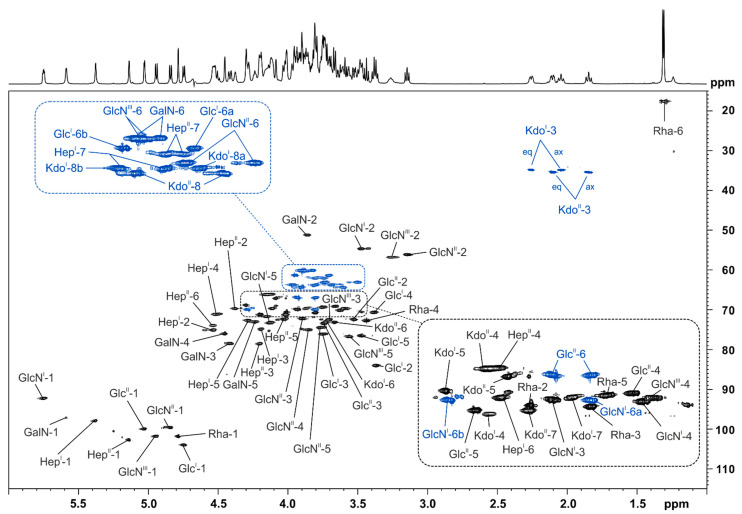
Figure 4.
NMR analysis of the major O- and N-deacylated core-LA carbohydrate backbone molecule (1) of Pst DC3000 ΔwbpL after HPAEC-fractionation. Shown above is a section (δH 6.0–1.0; δC 115–15) of the 1H,13C-HSQC NMR spectrum, recorded at 310 K in D2O as dept-version (blue: CH2-groups, black: CH/CH3-groups), including assignment of signals. The corresponding NMR chemical shift data are listed in Table 3, Table 4 and Table 5.

