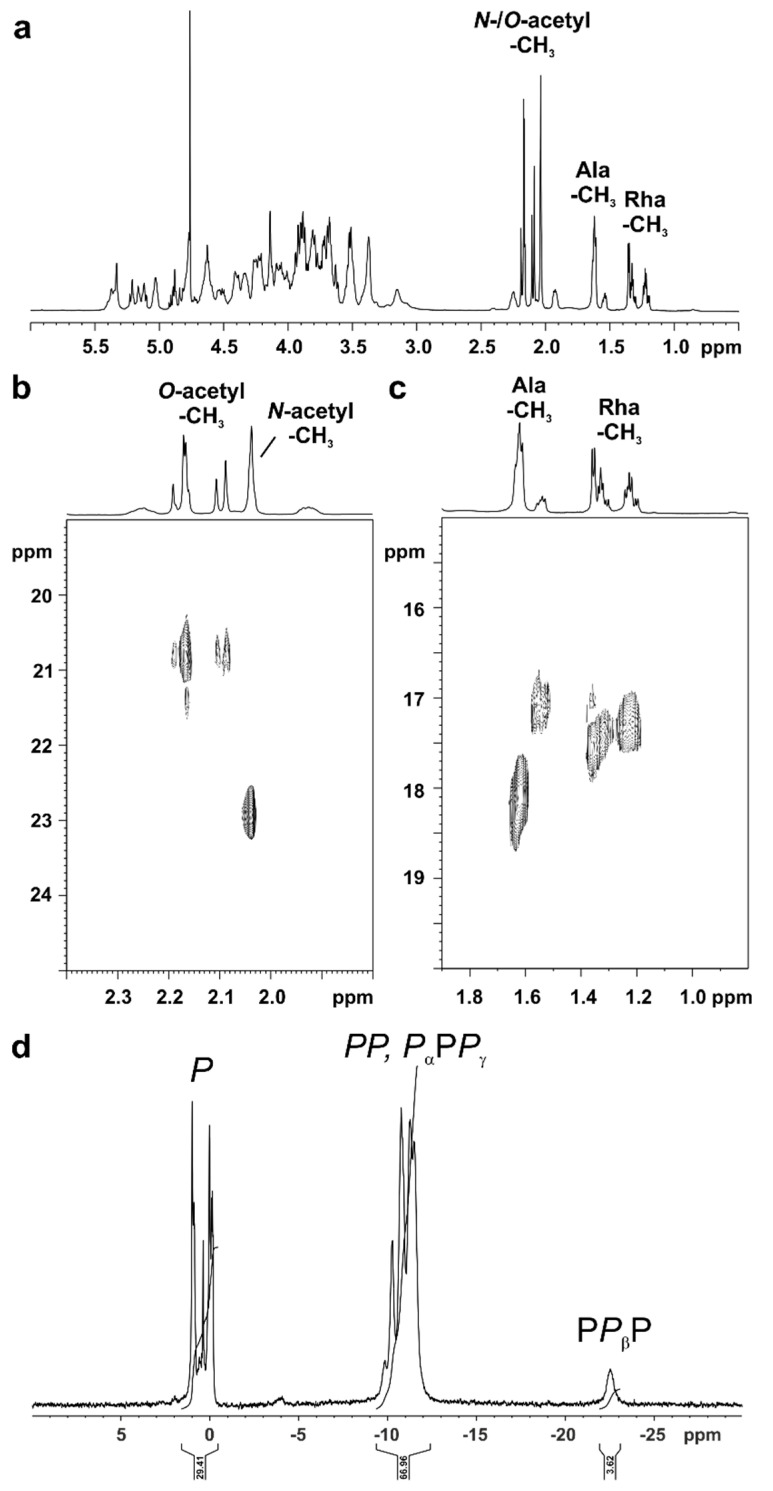
Figure 6.
NMR analysis of the OSHOAc preparation of Pst DC3000 ΔwbpL LPS. (a) Shown above is the full 1H NMR spectrum (δH 6.0–0.5; recorded in D2O at 300 K); regions for signals resulting from N-/O-acetyl groups, Ala-CH3, and Rha-CH3, respectively, are indicated. (b,c) Sections of the 1H,13C-HSQC NMR spectrum showing regions with 1H,13C-cross correlations for N-/O-acetyl groups (δH 2.40–1.80; δC 25–19; (b)) as well as Ala-CH3 and Rha-CH3 moieties (δH 1.90–0.80; δC 20–15; (c)) are shown. The signal assignment is discussed in the text. (d) Shown above is the 31P NMR spectrum (δP 10-(-30)) recorded in D2O at 300 K. Monophosphates (P) are represented by the group of signals between δP 2 and −1 ppm, diphosphates (PP) as well as Pα and Pγ of triphosphates appear between δP −9 and −12 ppm, and Pβ of triphosphates is represented by the broad signal between δP −22 and −23 ppm.

