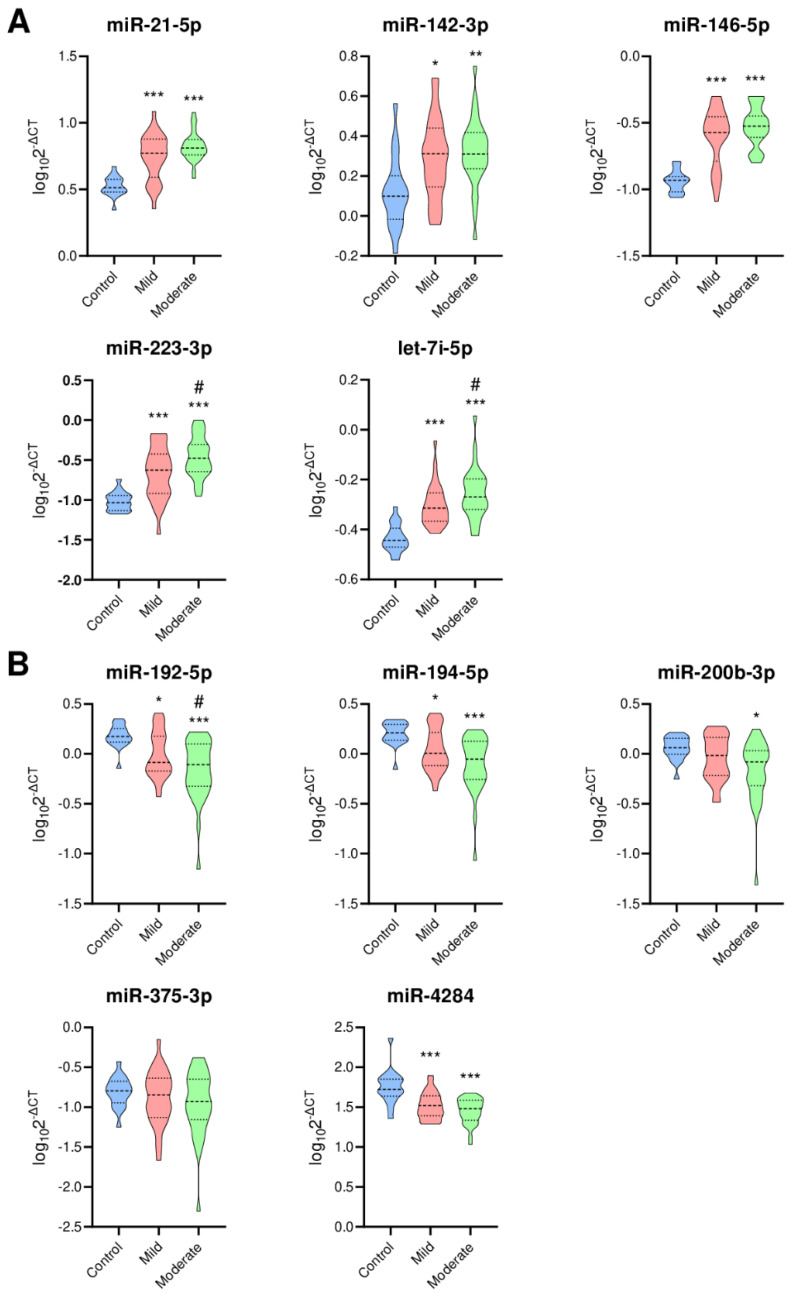
Figure 1.
Expression of selected 10 miRNAs. (A) Upregulated miRNAs; (B) Downregulated miRNAs. Violin plots indicating expression of each miRNA. Blue, red and green violins indicate controls, mild UC patients and moderate UC patients, respectively. Thick dotted line, median; thin dotted line 25% and 75% quartiles. Y-axis is defined as log10(2-ΔCT). * p < 0.01, ** p < 0.001, *** p < 0.0001 versus control, # p < 0.05 versus mild UC patient.

