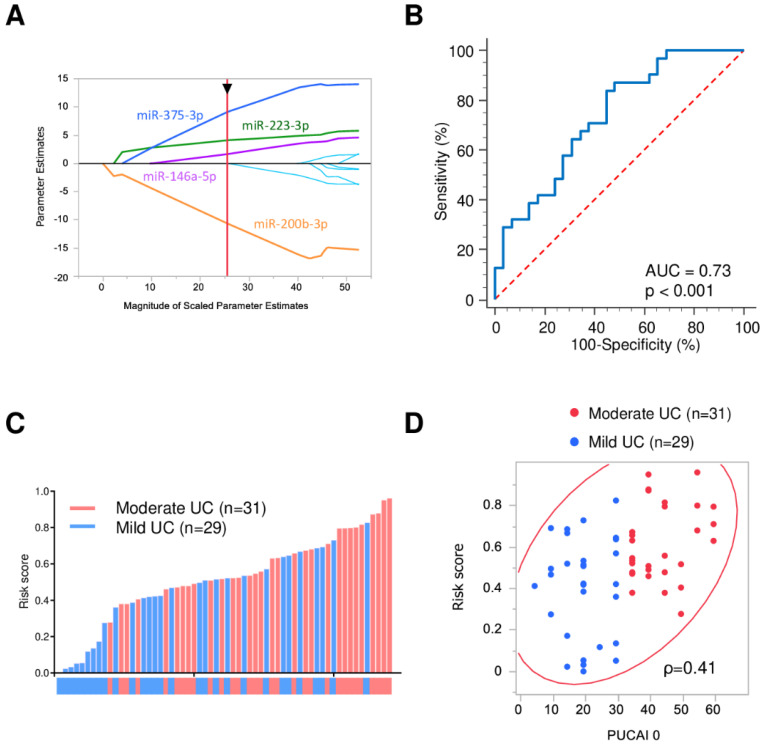
Figure 3.
Diagnostic accuracy of 4-miRNA panel for identifying severity of UC patients. (A) Adaptive LASSO model; (B) ROC curves for detecting UC patients using 4-miRNA panel; (C) A waterfall plot representing risk score of each patient. Red and blue columns indicate moderate and mild UC patients, respectively; (D) A scatter plot showing the correlation of PUCAI with risk score. Red and blue circles indicate moderate and mild UC patients, respectively. ρ is the Spearman’s rank correlation coefficient.

