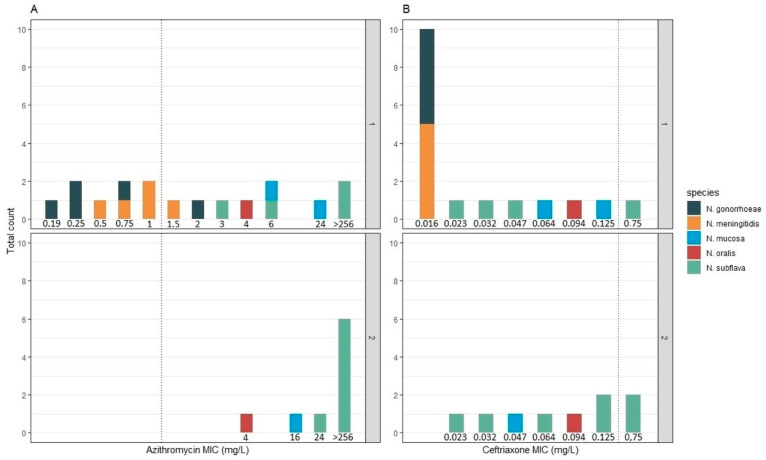
Figure 2.
Visit 1 (1) and visit 2 (2) distribution of MICs (mg/L) of azithromycin and ceftriaxone in the panel: Azithromycin MIC distribution from visit 1 and visit 2 (A). Ceftriaxone MIC distribution from visit 1 and visit 2 (B). Dotted line indicates a breakpoint for N. gonorrhoeae (ECOFF for azithromycin) and species are coded by color.

