Figure 1.
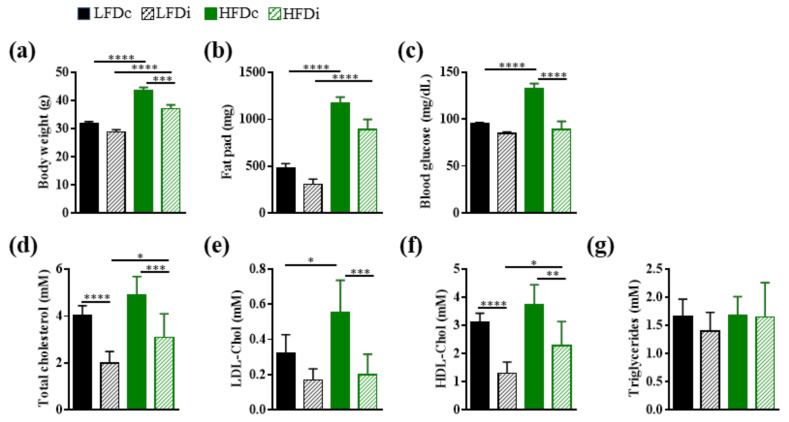
Metabolic parameters. Mice were fed low-fat diet (LFD) supplemented with cellulose (LFDc) or inulin (LFDi), or high-fat diet (HFD) supplemented with cellulose (HFDc) or inulin (HFDi) for 11 weeks. Mice were monitored for body weight (a), fat pad (b), 15h-fasting blood glucose (c) and serum concentration of total cholesterol (d), LDL-cholesterol (LDL-Chol; (e)), HDL-cholesterol (HDL-Chol; (f)) and triglycerides (g). Body weight, fat pad and blood glucose analyses are presented as mean ± SEM (n = 12 for the LFDc, HFDc and HFDi groups and n = 11 for the LFDi group). Lipid and lipoprotein concentrations are presented as mean ± SD (n = 8 for the LFDi group, n = 7 for the LFDc and HFDi groups, and n = 6 for the HFDc group). * p < 0.05, ** p < 0.01, *** p < 0.001 and **** p < 0.0001.

