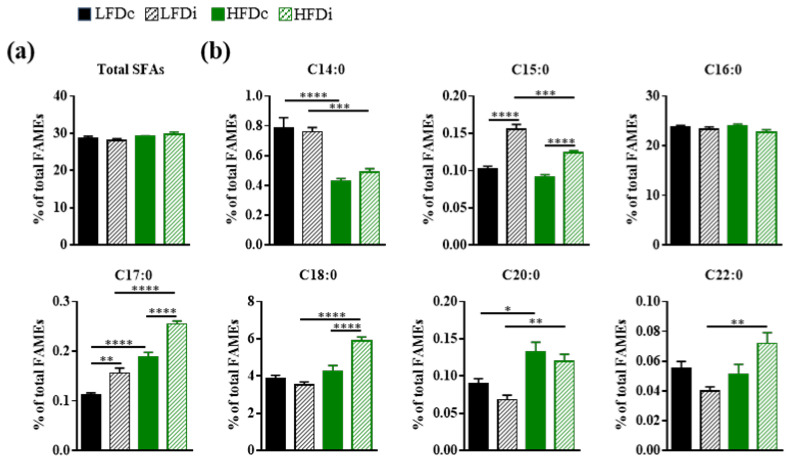
Figure 3.
Hepatic content in saturated fatty acids. Mice were fed low-fat diet (LFD) supplemented with cellulose (LFDc) or inulin (LFDi), or high-fat diet (HFD) supplemented with cellulose (HFDc) or inulin (HFDi) for 11 weeks. Percentages of (a) total saturated fatty acids (SFAs) or (b) individual SFAs relative to total FAMEs. Data are presented as mean ± SEM (n = 12 for the LFDc and HFDc groups and n = 11 for the LFDi and HFDi groups). * p < 0.05, ** p < 0.01, *** p < 0.001 and **** p < 0.0001.

