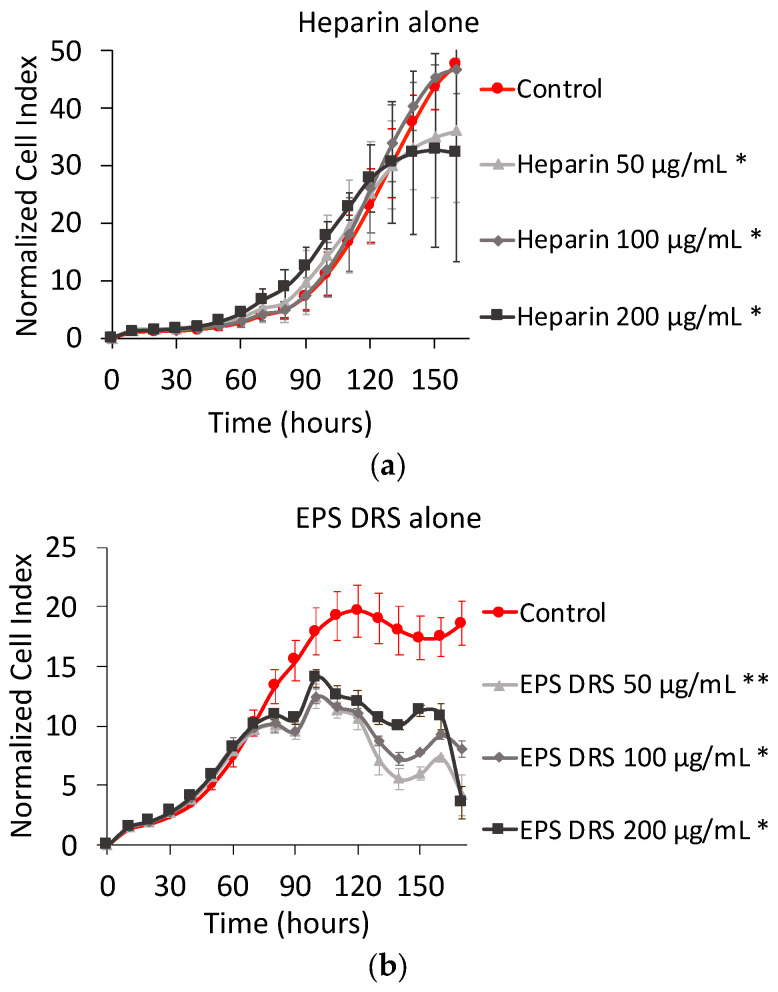
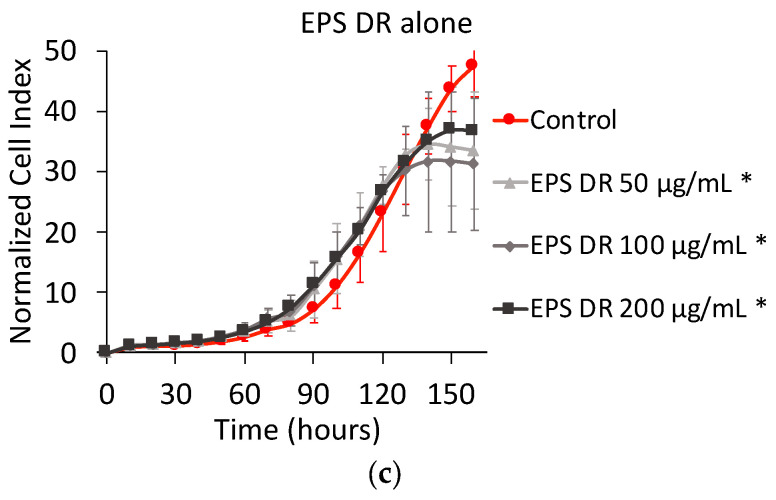
Figure 2.
To the left, normalized cell index plot of MNNG/HOS cells after 160 of contact with (a) heparin alone at 50 µg mL−1 (*), 100 µg mL−1 (*), and 200 µg mL−1 (*); (b) EPS DRS alone at 50 µg mL−1 (**), 100 µg mL−1 (*), and 200 µg mL−1 (*); (c) EPS-DR alone at 50 µg mL−1 (*), 100 µg mL−1 (*), and 200 µg mL−1 (*).


