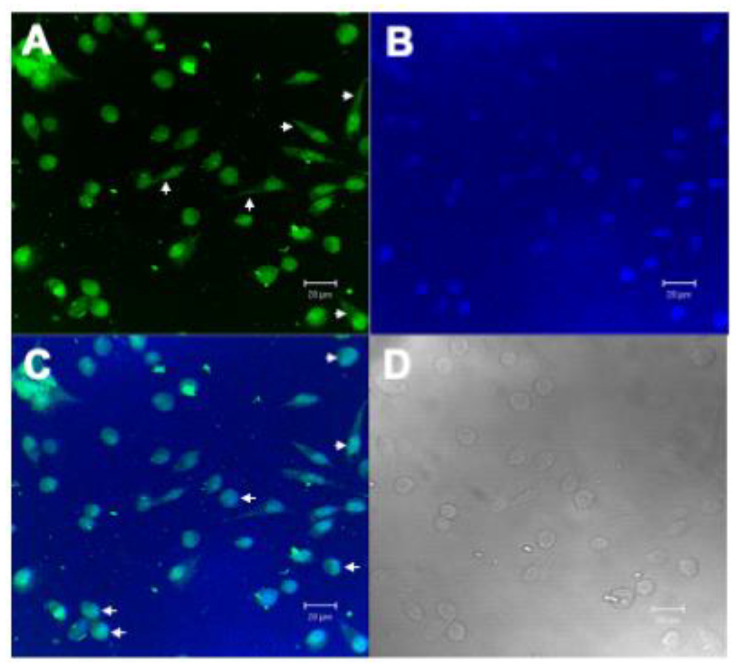
Figure 5.
Confocal Microscopy Analysis of L929 with EcTI-AlexaFluor488. (A) L929 cells marked with EcTI conjugated with AlexaFluor 488 (green), showing cell surface localization (arrowheads), (B) L929 nuclei stained with 4′,6-Diamidino-2-phenylindole dihydrochloride, DAPI (blue), (C) overlay of images with EcTI nuclear localization (arrowheads) in L929 cells and (D) differential interference contrast (DIC) microscopy of L292 cells. Scale bar: 20 µm.

