
Figure 4.
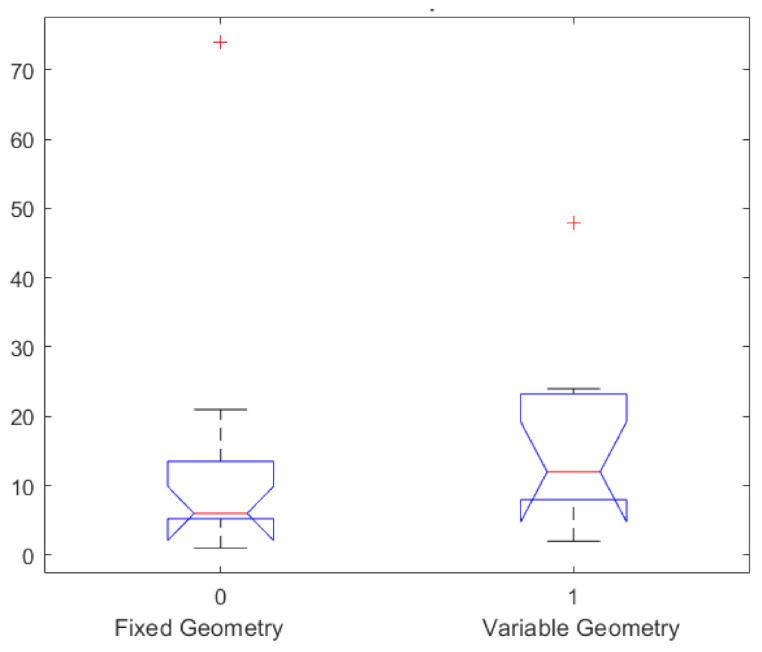
Boxplot of overall survival values in months in the two groups treated, respectively, with fixed and variable geometry.
Official websites use .gov
A
.gov website belongs to an official
government organization in the United States.
Secure .gov websites use HTTPS
A lock (
) or https:// means you've safely
connected to the .gov website. Share sensitive
information only on official, secure websites.
Boxplot of overall survival values in months in the two groups treated, respectively, with fixed and variable geometry.