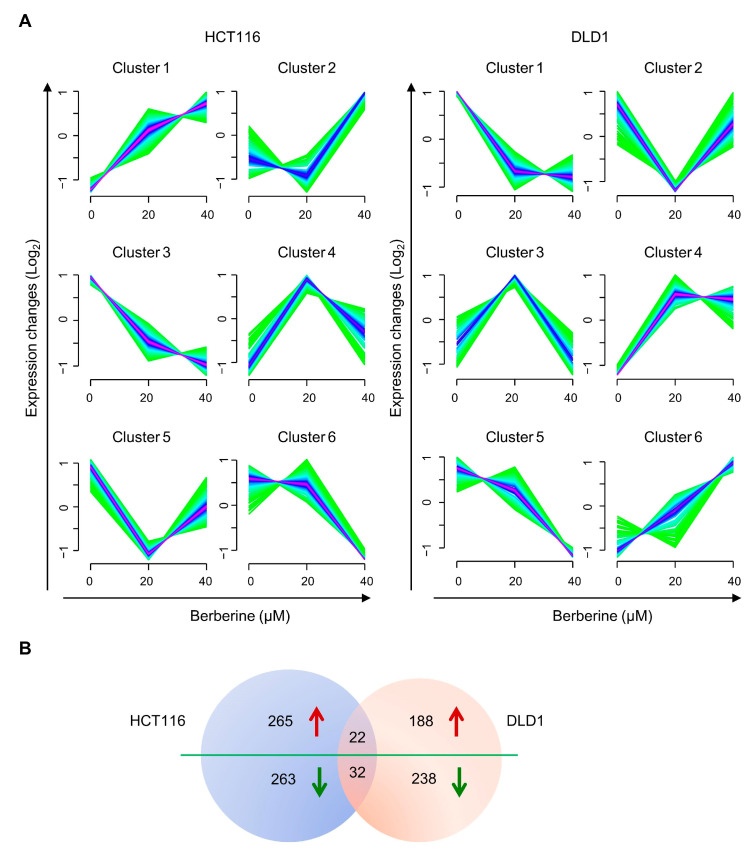
Figure 3.
Soft clustering analysis of differently expressed proteins (DEPs) in berberine-treated HCT116 and DLD1 cells. (A) Protein expression changes of berberine-treated HCT116 and DLD1 cells in six clusters. The color varying from green to red represents that the degree of protein expressions matching with the patterns of the cluster. (B) Venn diagram of DEPs between HCT116 and DLD1 cell lines. Red arrows indicate up-regulated trend and green arrows indicate down-regulated trend.

