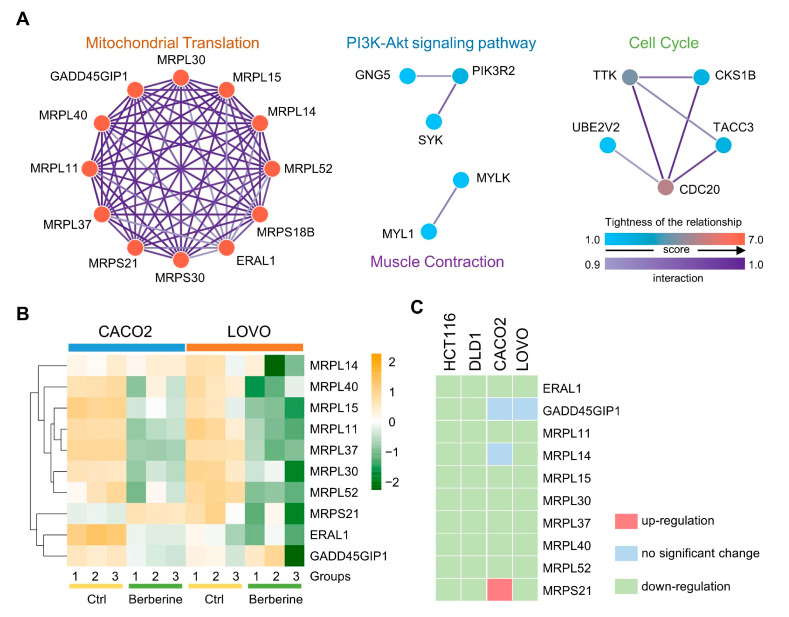
Figure 5.
Selection of hub proteins in berberine-treated colon cancer cells. (A) Four clusters of Protein–Protein Interaction (PPI) networks from common DEPs between HCT116 and DLD1 cells. The color varying from blue to red represents the tightness of the relationship among DEPs; the deeper purple means a higher interaction score. (B) Heatmap of protein changes in berberine-treated CACO2 and LOVO cells. The data were obtained from re-analysis of previous reports [32]. Groups indicate three independent replicates used for LC-MS/MS analysis; color bar indicates the Z-score of intensities. (C) Ten proteins were commonly determined in four berberine-treated colon cancer cell lines, and trends of protein changes were indicated with three different colors.

