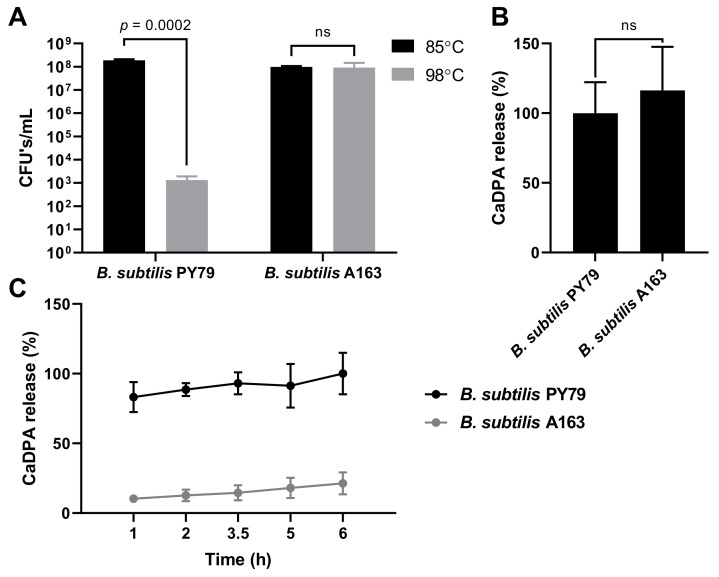
Figure 1.
Heat resistance test and DPA content of B. subtilis spores. The standard deviation is shown in the graphs. Statistical significance was determined using Student’s t-test. ns, not significant. (A) Numbers of colonies formed on LB agar plates of B. subtilis spores wet heat treated at 85 ℃ and 98 ℃ for 10 min. (B) Amount of CaDPA released by B. subtilis spores that were autoclaved at 121 ℃. The amount of CaDPA released by spores was calculated as % of CaDPA released by B. subtilis PY79. (C) CaDPA released by B. subtilis spores heat treated at 98 ℃ for 1–6 h. The amount of CaDPA released by spores was calculated as % of the total CaDPA.

