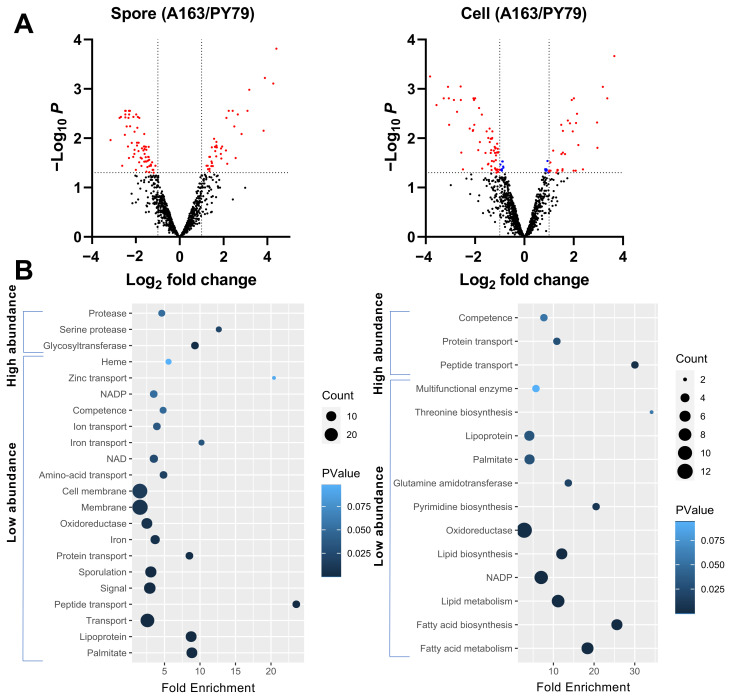
Figure 4.
Quantitative comparison of proteomes in spores and cells of B. subtilis PY79 and A163. (A) Volcano plots of the quantified proteins in spores of the two strains and the proteome comparison of their correspondent cells. Log2 fold changes smaller than 0 (or larger than 0) indicate proteins with low (or high) abundance in B. subtilis A163. Dots in red indicate proteins in B. subtilis A163 that were differentially present more than twofold with p < 0.05. Dots in blue indicate proteins that were present with Scheme 0. but less than twofold. (B) Uniprot categories enrichment of the differentially presented proteins in spores and cells of B. subtilis A163. The fold enrichment is defined as the ratio of two proportions. The first proportion is the quantified proteins belonging to a UniProt category divided by all high- (or low-) abundant proteins. The second proportion is all proteins belonging to the UniProt category in the genome divided by the total proteins in the genome. The size of the dots is indicative of the number of quantified proteins (Count) belonging to a particular term, as shown in the legend. The color of the dots is corresponding to the Fisher exact p-value (PValue), again as shown in the legend.

