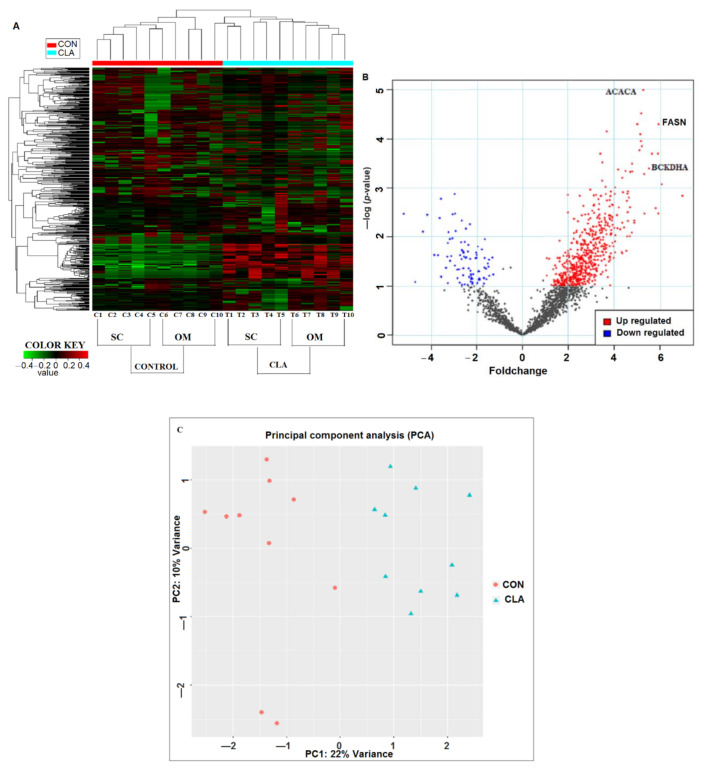
Figure 2.
Differential expression analysis of phosphoproteome by IDEP 9.1 server using fold change and p-values of phosphopeptides. (A) Heat map analysis of significantly expressed phosphopeptides of control cow subcutaneous (SC) AT (C1–C5); control cow omental (OM) AT (C6–C10); CLA-supplemented cow SC AT (T1–T5); CLA supplemented OM AT (T6T10). The data represent the mass intensity of each peptide in the individual cows. Red boxes indicate upregulation, green boxes represent downregulation, and black boxes represent no change. (B) Volcano plot illustrates the significant expressed peptides of CON vs. CLA-supplemented dairy cows. The significant upregulated peptides are in red color and downregulated are in blue color. X-axis represents fold change and y-axis represented p-value. FASN-fatty acid synthase; ACACA-acetyl-CoA carboxylase 1; BCKDHA-branched-chain keto acid dehydrogenase E1 alpha. (C) Principal component analysis (PCA) of 22% variance in CON vs. CLA-supplemented SC and OM AT. PCA representing the separation of CON (red circles) with CLA-supplemented (blue triangles) samples.

