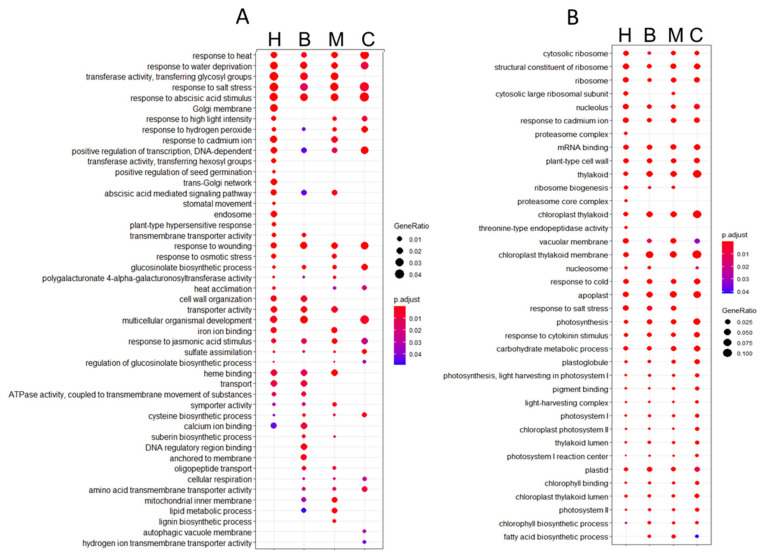
Figure 3.
Gene set enrichment (GSEA) analysis of DEGs in Col-0 seeds under severe heat stress. (A) Functional enriched GO terms from upregulated differentially expressed genes. (B) Functional enriched GO terms from downregulated DEGs. The size of the dot represents the gene count. The totality of differentially up- or downregulated genes in each stage was used to perform a hypergeometric test, and the p-values were converted to false discovery rate (FDR)-corrected p-value as shown in colors, the red color being more significant than the blue color. H = heart, B = bent, M = mature, and C = common to all stages.

