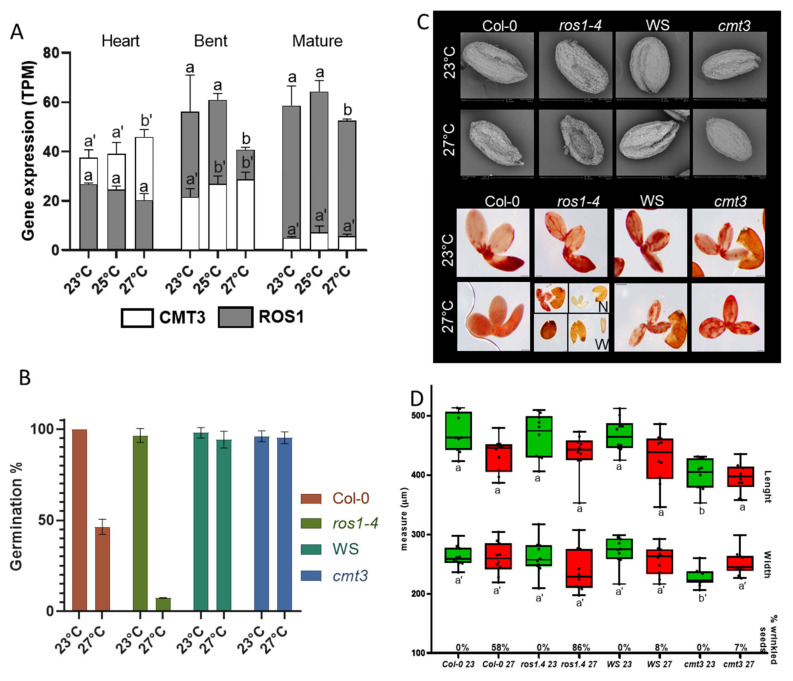
Figure 4.
Evaluation of CMT3 and ROS1 expression and physiology of cmt3 and ros1-4 mutants. (A) Gene expression in TPM of CMT3 and ROS1 at heart, bent, and mature stages of embryo development during control temperature (23 °C), MS (25 °C) and SS (27 °C). CMT3 is represented by white bars while ROS1 is represented by grey bars. Standard deviation is shown. Two-way ANOVA comparing differences in gene expression at 23 °C, 25 °C, and 27 °C for each genotype at the same stage. Letters represent statistically significant differences with a p-value < 0.001. Letters a or b used for ROS1 and letters a’ or b’ used for CMT3. (B) Seed germination for wild-type (Col-0 or WS) and mutant (ros1-4 or cmt3) genotypes at 23 °C (green) and 27 °C (red) average temperature. (C) Panels show embryos and seed coats from wild-types (Col-0 or WS) and mutant (ros1-4 or cmt3) genotypes at 23 °C and 27 °C average temperature. The upper panel is composed of electronic microscopy photos for phenotype observations and the lower panel shows embryo survival evaluation with TTZ. ros1-4 at 27 °C was divided into normal-shaped seeds (N) or wrinkled-shaped seeds (W). (D) Seed measurements of length and width in micrometers. Boxes and whiskers showing minimum and maximum with median line from all observations. Green bars represent temperature at 23 °C and red bars represent the temperature at 27 °C (SS). Two-way ANOVA comparing difference size between wild-types (Col-0 or WS) and mutants (ros1-4 or cmt3), respectively, at 23 °C wild-type against 23 °C mutant, and 27 °C wild-type against 27 °C mutant, therefore green against green and red against red. Letters represent statistically significant differences with a p-value < 0.001. Letters a or b used for length measures and letters a’ or b’ used for width measures. Percentage of wrinkle-shaped seeds for each genotype at 23 °C and 27 °C is shown at the base of the x-axis.

