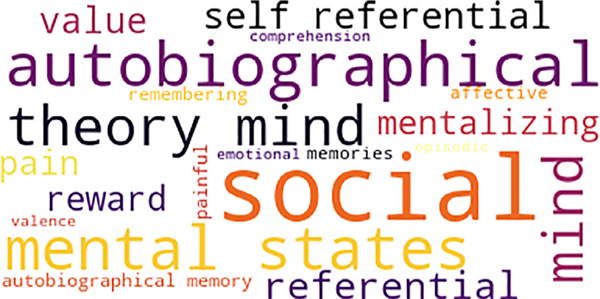
Fig. 4.
Decoding of the ALE map for the full sample using Neurosynth decoder. The decoder was used to compare the unthresholded ALE map (full sample) with statistical maps generated by Neurosynth across a wide range of terms (1,335 terms). Depicted above is the word cloud showing the top 20 relevant cognitive terms that correlated with the pattern of activation for social exclusion. Font size represents relative correlation strength of that term to the full sample Cyberball meta-analytic results.

