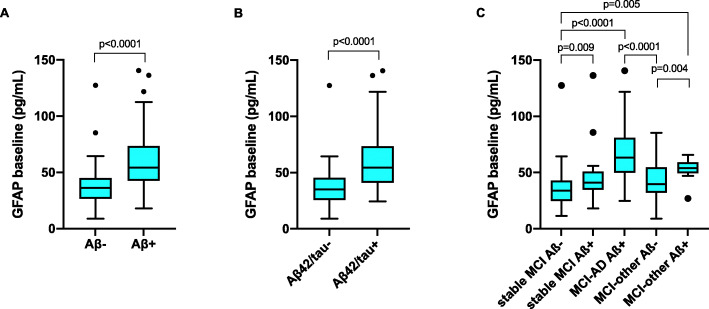
Fig. 1.
a Plasma GFAP in the Aβ-positive (Aβ+, CSF Aβ42/Aβ40 < 0.07) and Aβ-negative (Aβ−, CSF Aβ42/Aβ40 > 0.07) groups. b Plasma GFAP in the Aβ42/tau positive (Aβ42/T-tau+, CSF Aβ42/T-tau < 7.3) and Aβ42/tau negative (Aβ42/tau−, CSF Aβ42/T-tau > 7.3) groups. c Plasma GFAP in the stable MCI, MCI-AD and MCI-other groups stratified by Aβ status. Line across represents median, box represents interquartile range (IQR), bars represent min and max value (within ± 1.5 IQR). P values were calculated with univariate linear model and least significant differences (LSD) post hoc tests, with adjustments for age and sex

