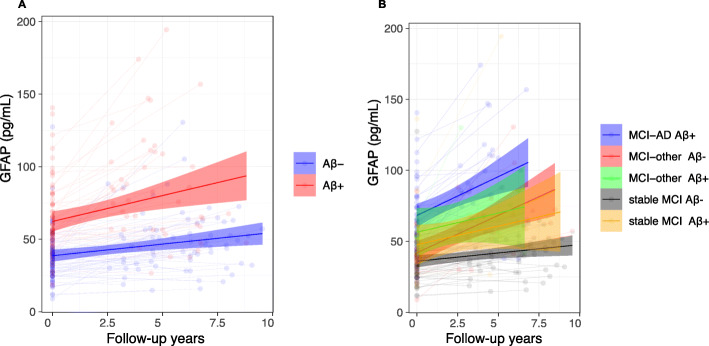
Fig. 3.
Longitudinal slopes for plasma GFAP from linear mixed-effects model adjusted for age and sex. X-axis represents time between baseline and follow-up plasma sampling; y-axis represents plasma concentrations in pg/mL. Plasma GFAP measurements were stratified by Aβ-positive (Aβ+) status defined by CSF Aβ 42/40 < 0.07 (a). Slopes for Aβ-positive subjects were significantly steeper than Aβ-negative (p = 0.007). In b, plasma GFAP measurements were stratified by clinical diagnosis at follow-up and Aβ status. GFAP slopes in MCI-AD and Aβ-negative MCI-other subjects were significantly steeper compared to stable MCI Aβ-negative (p < 0.0001 both) and stable MCI Aβ-positive (p = 0.049, p = 0.037, respectively)

