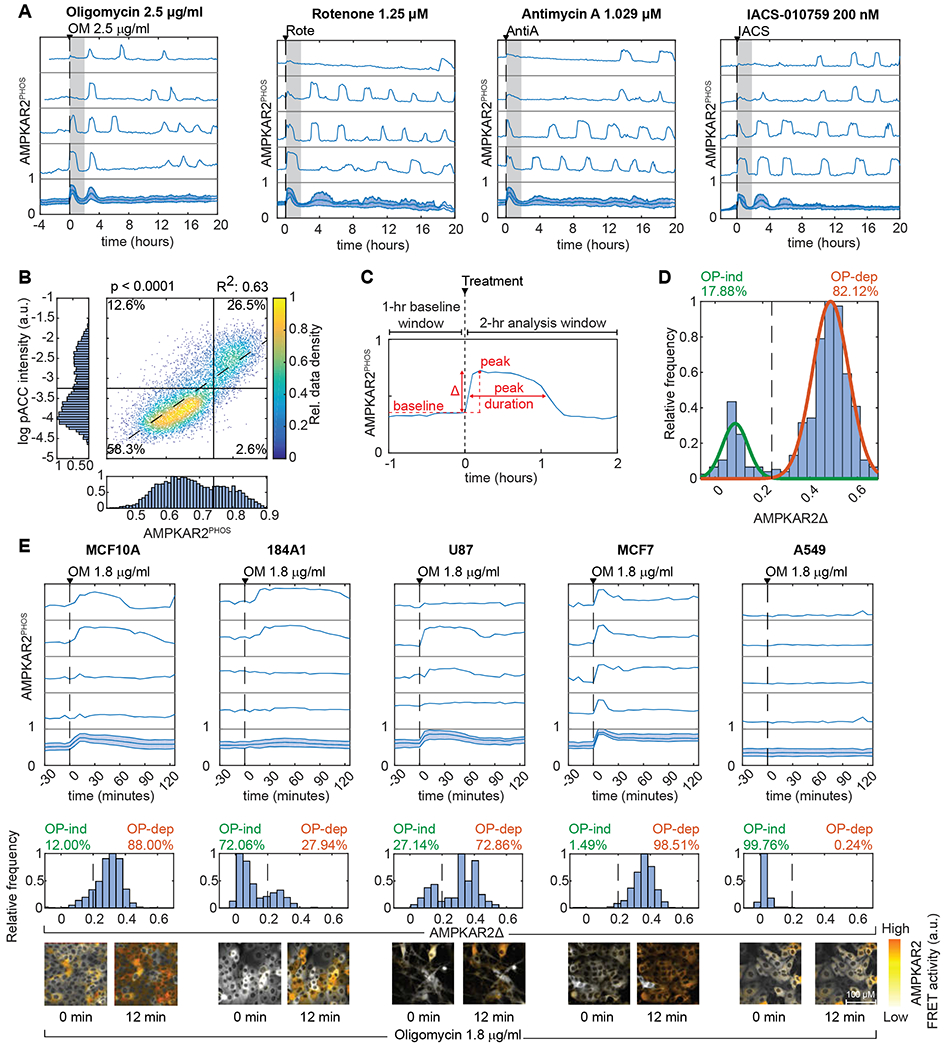
Figure 1 – Variable AMPK responses to OXPHOS inhibition are common.

A: AMPKAR2PHOS responses for cells grown in 17 mM glucose (see STAR Methods, imaging media table, for all formulations). Subplots represent single cells selected to depict the full range of responses, with population average and interquartile range in the bottom subplot. Gray shaded area shows the 2-hour time window used for analysis of peak height. N=2; see STAR Methods for definitions of replicates and cell numbers analyzed.
B: Single-cell measurements of AMPKAR2PHOS and pACC IF in MCF10A cells treated with 2.5 μg/ml oligomycin. AMPKAR2PHOS was measured in live cells 15-18 minutes after treatment; pACC was measured following fixation and linked to AMPKAR2PHOS for the same cell. R2 and p-value are shown for a fitted linear function (dashed line). N=2.
C: Schematic of AMPKAR2 pulse parameterization. Peak activity was defined as the local maximum value within 2 hours after perturbation; baseline was defined as the average of AMPKAR2 activity for one hour before treatment. Amplitude (AMPKARΔ) was calculated by subtraction of baseline from peak.
D: Histogram of AMPKAR2Δ values after treatment with 2.5 μg/ml oligomycin. Green and orange lines are fitted Gaussian distributions. The dashed line is defined by the intersection between distributions and used as the cutoff for determining the percentage of OP-ind or OP-dep cells. N=2.
E: Comparison of AMPK responses across cell lines. Top panels – representative AMPKAR2PHOS measurements for cells grown in 17 mM glucose without insulin and EGF, treated with 1.8 μg/ml oligomycin. Each subplot represents a single cell measurement, with population average and interquartile range in the bottom subplot. Middle panels - histograms of AMPKAR2Δ in response to oligomycin (OM) 1.8 μg/ml treatment. Dashed lines are defined by the intersection of fitted bimodal distributions using pooled data for treated and untreated cells within each cell line. Bottom panels - sample images of AMPKAR2 responses. N=3.
