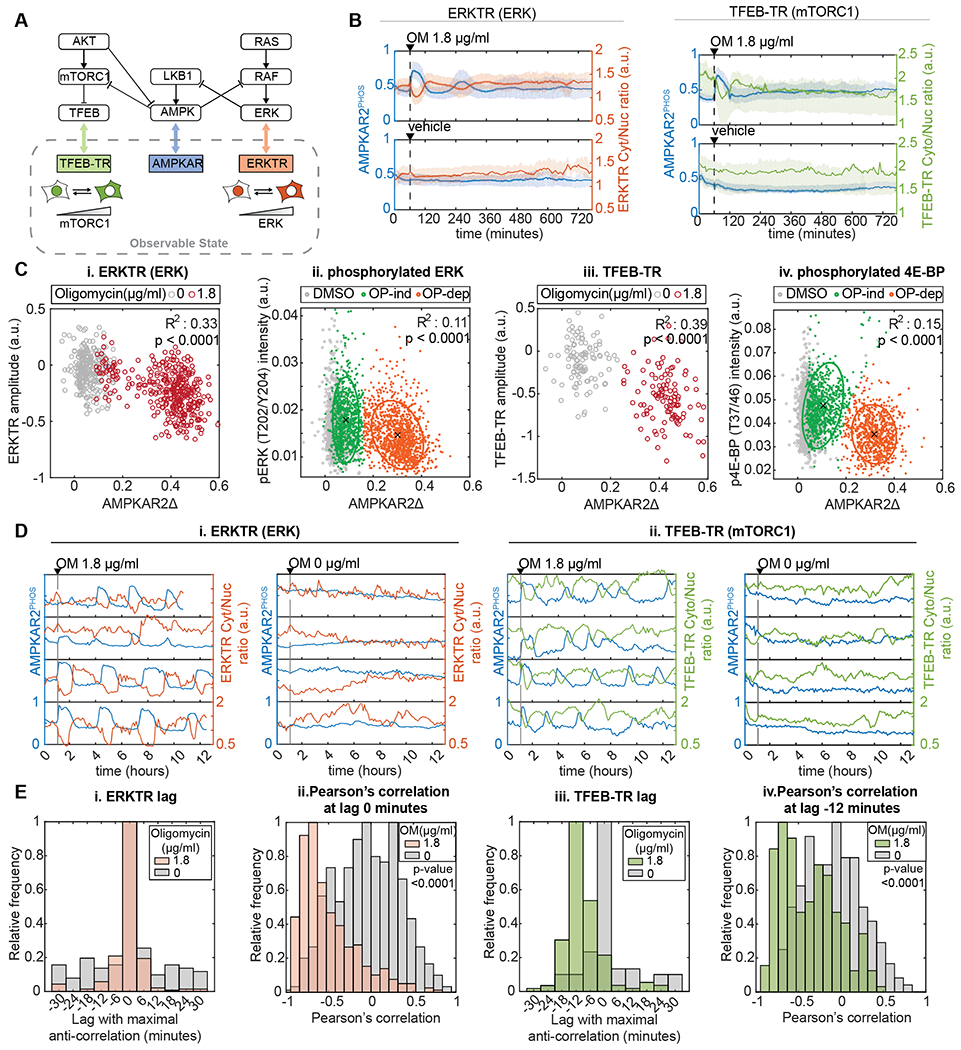
Figure 2 – Heterogeneous AMPK responses propagate to downstream signaling activity.

A: Known connections between AMPK, mTORC1 and ERK, and corresponding reporters for live-cell analysis. ERKTR and TFEB-TR indicate the activities of ERK and mTORC1, respectively, by their cytoplasmic to nuclear ratio.
B: Population average responses of AMPKAR2PHOS (blue) compared to ERKTR (orange) and TFEB-TR (green) after oligomycin (OM, upper panels) or vehicle (lower panels) treatment. Shaded areas indicate interquartile ranges. N=2.
C: Correlation of AMPKAR2Δ with signaling markers in single cells. Each dot indicates a single cell in which AMPKAR2Δ was measured in tandem with (i) ERKTR (live-cell), (ii) phosphorylated ERK (IF), (iii) TFEB-TR (live-cell), or (iv) phosphorylated 4E-BP1. For live-cell measurements, values represent amplitude of response. For IF measurements, values represent integrated staining intensity for cells fixed immediately following measurement of AMPKAR2Δ. R2 and p values are shown for linear regression against pooled data for both untreated and oligomycin-treated cells. N=2.
D: Dynamic relationship of AMPK activity with (i) ERK and (ii) mTORC1 reporters. Representative single-cell profiles of AMKPAR2PHOS were measured in the same cell as ERKTR (orange) or TFEB-TR (green).
E: Cross-correlation analysis for AMPK activity with ERK and mTORC1 reporters. (i) and (iii) show distributions of the lag time at which maximum anti-correlation is found between AMPKAR2 and ERKTR or between AMPKAR2 and TFEB-TR, respectively, (ii) and (iv) show the distribution of Pearson’s cross-correlation coefficients at the lag time with maximum correlation (0 minutes for ERKTR, −12 minutes for TFEB-TR). N=2.
