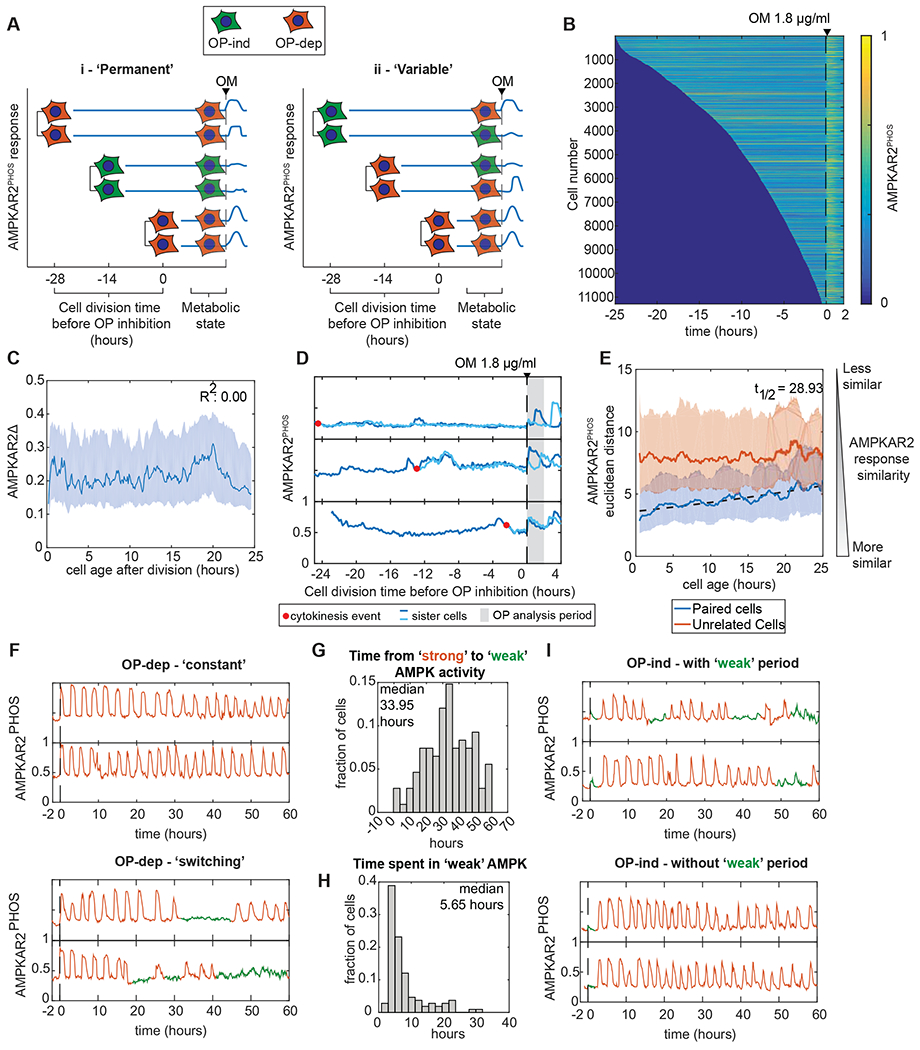
Figure 4 – OXPHOS inhibitor resistance is a heritable but transient cellular state.

A: Schematic of sister cell analysis to distinguish between permanent and time-varying cell states determining the response to OXPHOS inhibition.
B: Heatmaps of AMPKAR2PHOS in individual cells. MCF10A-AMPKAR2 cells were imaged for 24 hours before treatment with 1.8 μg/ml oligomycin. Each horizontal line represents a single cell’s AMPKAR2PHOS profile, beginning with its most recent cell division and ending 2 hours after oligomycin (OM) treatment. Cells were sorted by the time of their last division. Analysis contains >11,000 individual cells. N=3.
C: Line plot of the relationship between a cell’s age at the time of oligomycin treatment and its recorded AMPKAR2Δ response.
D: Sample traces of AMPK activity from sister cell pairs.
E: Comparison of AMPKAR2PHOS responses in sister cells. Dissimilarity between the sisters of each division, or between randomly chosen pairs of cells was calculated (see Methods). Solid lines represent effect size, and the shaded areas represent interquartile range after bootstrapping. Dashed line represents a fitted exponential function for the decay of sister cell similarity over time.
F: Transitions in OXPHOS dependence within single cells. Top panels show two example cells in which strong AMPK activity (continued pulsing) persists for the remainder of the experiment. Bottom panels show two example cells that transition from strong activity (orange) to a state with weak AMPK activity (green). N=2.
G: Distribution of transition times from strong to weak AMPK activity. For all cells showing a transition as shown in the bottom panels of (F), the time between oligomycin treatment and the first transition is shown as a histogram.
H: Distribution of durations of weak AMPK activity states. For all cells showing both entry into and exit from an OP-ind state during the experiment (green phases in (F)), the interval between entry and exit is shown as a histogram.
I. Examples of cells transitioning from a weak to a strong AMPK state. Top panels show example cells that transition to strong and then return to weak activity. Bottom panels show instances of cells that transition to strong activity for the remainder of the experiment.
