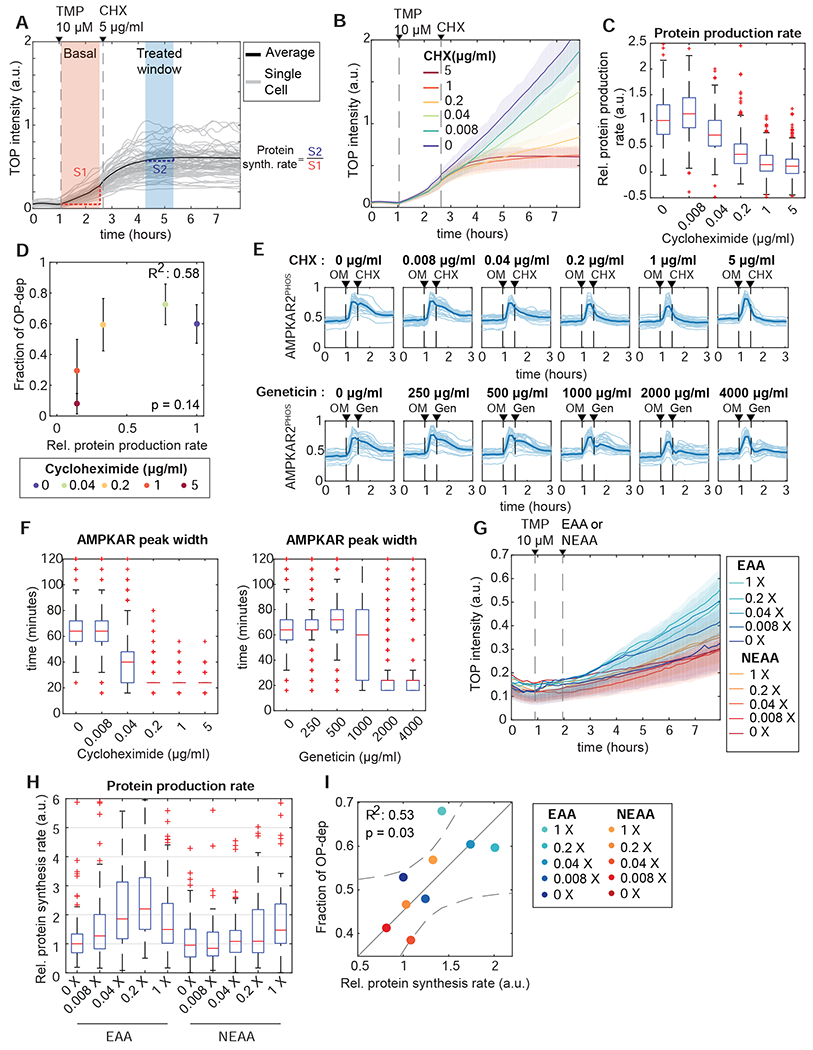
Figure 6 – Reducing protein synthesis rate promotes OXPHOS inhibitor resistance.

A: Measurement of protein synthesis rates in live cells. MCF10A cells stably expressing TOP-H2B-YFP-DD (TOP) were treated with the degron inhibitor trimethoprim (TMP). Protein production rate was calculated as the slope of YFP intensity change during the 60 minutes after TMP treatment (orange shaded area). The effect of CHX inhibition on protein production was quantified from the slope for a 60 minute period beginning 90 minutes after treatment (blue shaded area); relative protein production rate is calculated as the ratio of slopes in the blue and orange regions (S1 and S2 respectively).
B, C: Quantification of reduced protein synthesis rates. (B) shows mean TOP-H2B-YFP-DD intensity for a concentration series of CHX treatments. Shaded areas show interquartile ranges. (C) shows calculated single-cell relative protein production rates for each concentration of cycloheximide. Each box represents the distribution of >400 cells. N=2.
D: Relationship of average protein production rate to the fraction of OP-dep cells. Protein rate was measured as in (A-C). The corresponding fraction of OP-dep responses was determined by culturing cells in the same CHX concentrations, followed by oligomycin treatment. Points represent the mean, and error bars standard error of the mean; N=2.
E, F: Termination of AMPK activity pulses by protein synthesis inhibition. (E) shows single-cell traces (light lines) and means (dark lines) for cells treated with oligomycin (OM), followed by the protein synthesis inhibitors CHX or geneticin (Gen) at the concentrations indicated. (F) shows quantification of single cell AMPKAR2PHOS pulse widths after CHX (left panel) or geneticin (right panel) treatment. Pulse widths were calculated as the time at which AMPKARPHOS decreased to 50% of the maximum value for each cell following treatment with CHX or geneticin. N=2.
G-I: Modulation of protein synthesis and AMPK responses by amino acid availability. (G) shows representative mean TOP-H2B-YFP-DD intensity for MCF10A cells cultured in essential or non-essential amino acid at the indicated concentrations (X represents fold-change relative to the concentration in MEM). Shaded areas show interquartile ranges. (H) shows quantification of relative protein synthesis rates from the experiment shown in (G). Each box represents the distribution of >200 cells. (I) shows the mean protein synthesis rates from (G) plotted against the corresponding fraction of OP-dep cells, measured after oligomycin treatment in the same amino acid concentrations. Solid line represents a fitted linear model, and dashed lines the 95% confidence bounds. N=2.
