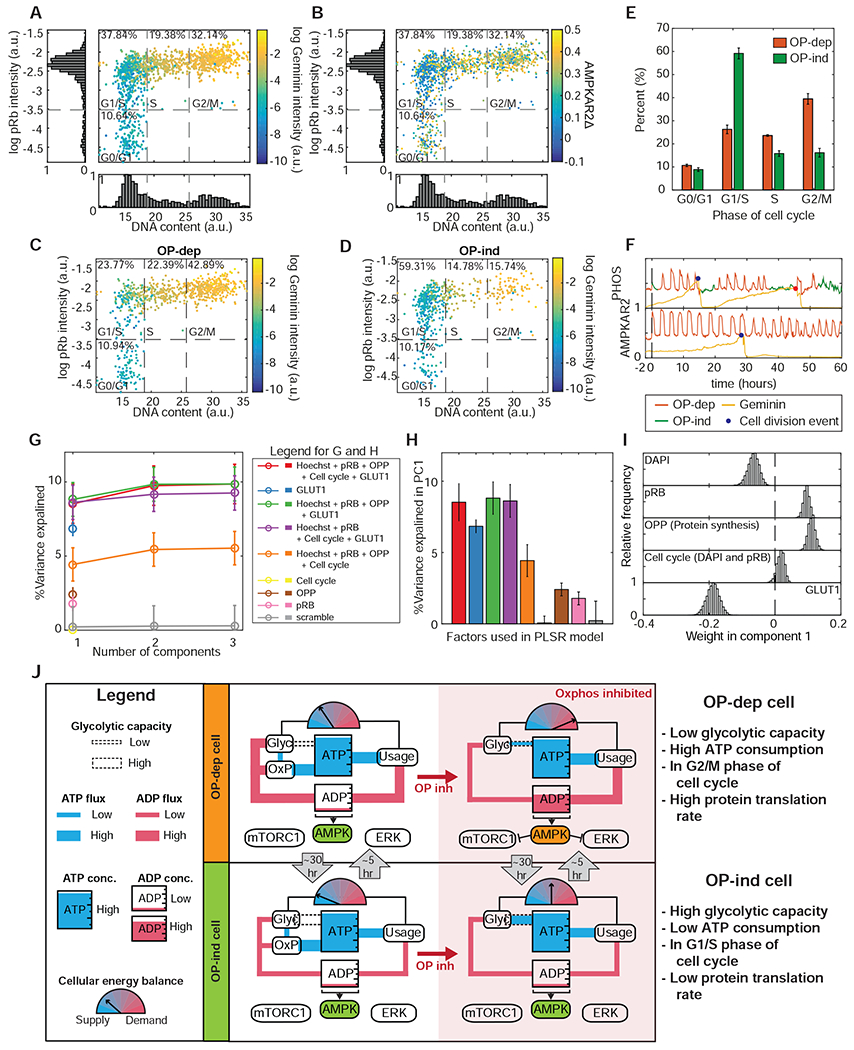
Figure 7 – OXPHOS inhibitor response states are inherently multivariate.

A: Scatter plot of single cell measurements of DNA content (Hoechst 33342 intensity) and phospho-Rb IF, colored by mCherry-Geminin1-330 intensity. Dotted lines divide the phases of the cell division cycle, with the percentage of cells in each phase indicated. N=3.
B: Scatter plot of cell cycle parameters as in (A), colored by AMPKAR2Δ values recorded during the 30 minutes immediately prior to fixation and staining. N=3.
C and D: Scatter plots of cell cycle parameters as in (A), divided between OP-dep cells (C) and OP-ind cells (D). N=3.
E: Bar graph comparing the distribution of cell cycle phases for OP-ind and OP-dep cells. Error bars represent standard errors of means; N=3.
F: Single cell traces of AMPK activity and mCherry-Geminin1-330 intensity for (top) a cell in which OP-ind occurs early in G0/G1, and (bottom) a cell in which no OP-ind phase occurs during G0/G1. Markers indicate the time of mitosis.
G: Predictivity of PLSR models of AMPKAR2Δ (percentage of total variance explained) including the indicated combinations of measurements. For the “scrambled” model, pairings between input and output measurements for each cell were randomly reassigned. Cell cycle position was estimated by using the Wanderlust algorithm for non-linear mapping. See STAR Methods and Figure S7D for details.
H: Bar chart showing percent of total variance explained by the first PLSR component for models using combinations of cellular processes measurement as indicated.
I: Contribution of measured processes to PLSR models for AMPKAR2PHOS response to oligomycin treatment. Distributions of parameter coefficients were generated by bootstrapping with replacement 10,000 times.
J: Simplified diagrams indicate the state of ATP metabolism in OP-ind and OP-dep cells. Blue “pipes” indicate flux of ATP, and red pipes the flux of ADP. Meter icons indicate the balance of ATP production capacity relative to ATP consumption. The dotted ‘pipe’ indicates reserve glycolytic capacity to supply ATP. OP-dep cells (top panel) have low glycolytic capacity with high ATP demand; upon OXPHOS inhibition, these cells maintain constant ATP concentration at the expense of an increase in ADP that triggers activation of AMPK and inhibition mTORC1 and ERK pathways. OP-ind cells (bottom panel) have high reserve glycolytic capacity and relatively low ATP demand. Upon OXPHOS inhibition, thesecells can maintain constant ATP and a low concentration of ADP via glycolysis, and AMPK consequently remains inactive.
