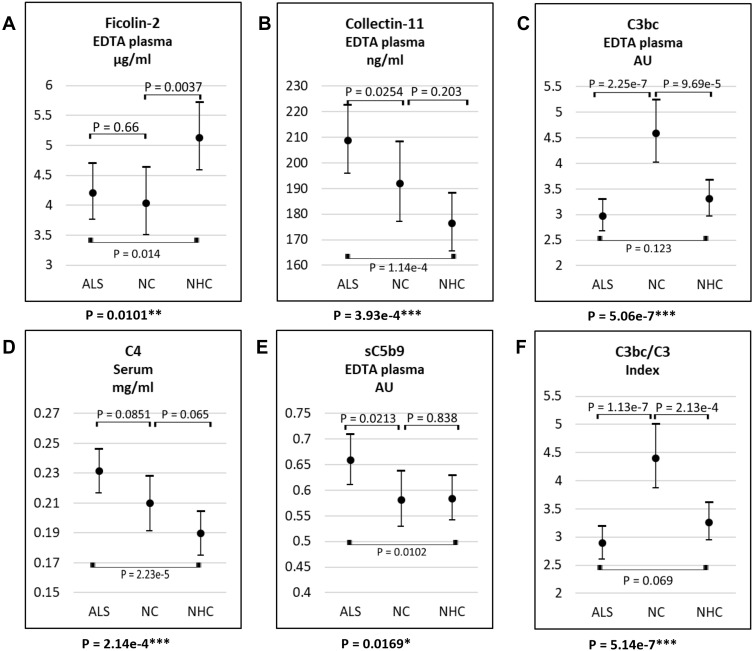
Figure 2.
Plasma or serum level of ficolin-2 (A), collectin-11 (B), C3bc (C), C4 (D), sC5b-9 (E), and C3bc/C3 (F) in samples from patients with ALS, NC, and NHC. The lower p-value of each figure describes that there is a significant difference in complement levels among the covariate groups. The remaining p-values describe whether there is a difference between the two, marked groups. *P-values = 0.01–0.05; **P-values = 0.01–0.001; ***P-values <0.0001.
Abbreviations: ALS: amyotrophic lateral sclerosis, NC: neurological controls, NHC: neurologically healthy controls.

