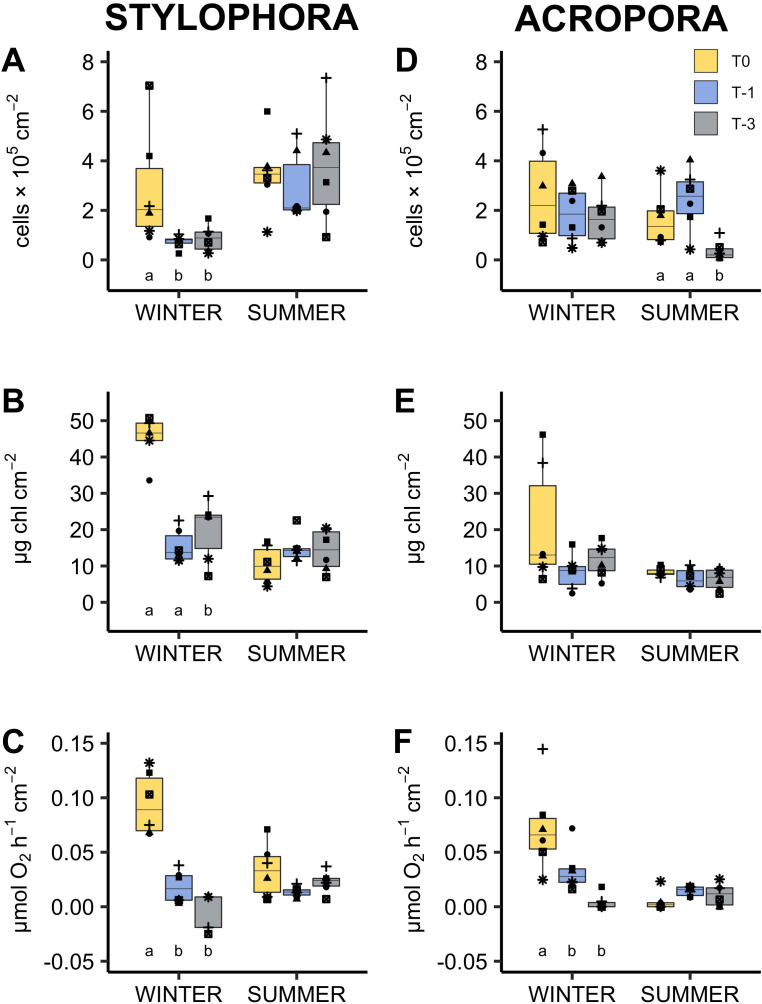
Figure 1. Response of algal symbionts of Stylophora pistillata (A–C) and Acropora eurystoma (D–F) exposed to below annual minima temperatures.
yellow = 22.4 °C, blue = 20.5 °C, grey = 18.6 °C (n = 5 or 6 /species /treatment). Box fill colours reflect the different winter thermal experience of these corals. During ‘summer’ all corals were exposed to 3 °C above maximum monthly mean. Plots are symbiont cell density (A, D), chlorophyll concentration (B, E) and rate of net oxygen production (C, F). Boxes display the median line, the first and third quartiles (box outline) and whiskers are 1.5 times the interquartile range. Shaped points refer to coral genotypes, consistent to all plots. Different lowercase letters denote significant treatment effects within each experimental phase (winter and summer, Linear Mixed Effect Model and Tukey post hoc test).

