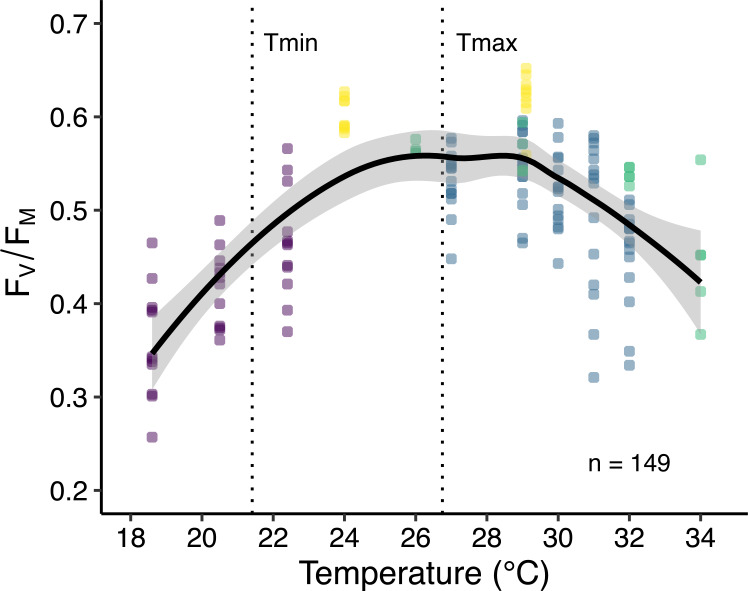
Figure 4. Thermal performance curve of maximum quantum yield of photosystem II (FV∕FM) of corals in Eilat.
Data are from published ex situ experiments including the current study (purple), Krueger et al., 2017 (yellow), Fine, Gildor & Genin, 2013 (green), and Bellworthy & Fine, 2017 (blue). Data points represent multiple species with thermal incubation times between 16 and 47 days (n = 149). The thick black line indicates the smoothed conditional mean with 99% confidence intervals (grey border). Dotted vertical lines indicate annual average minimum (Tmin) and maximum (Tmax) reef seawater temperatures in Eilat taken from the current paper and Bellworthy & Fine (2017) respectively.

