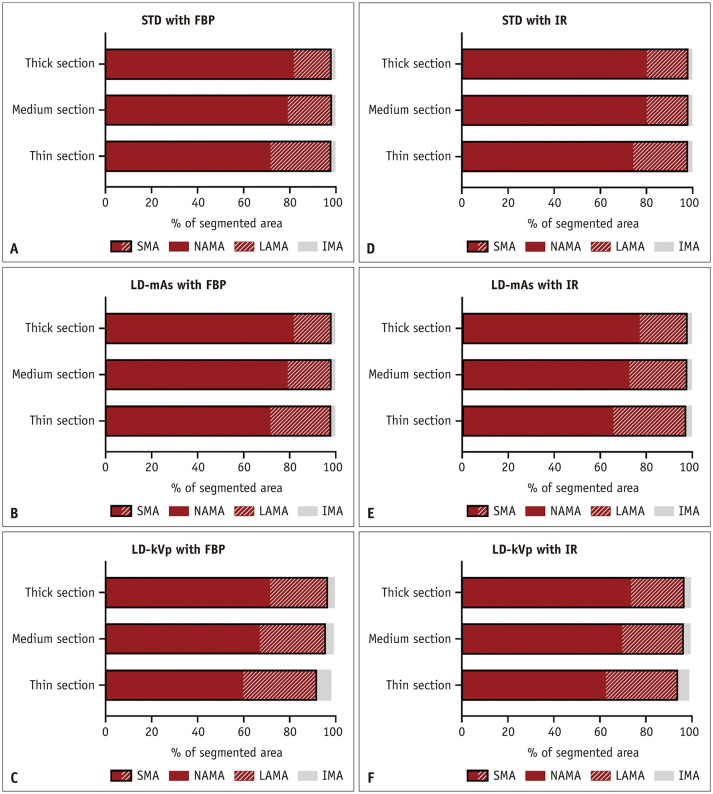
Fig. 3. Proportions of the segmented areas of muscle components with different CT protocols (A–F).
The area including NAMA and LAMA represents SMA. FBP = filtered back projection, IMA = intermuscular adipose tissue area, IR = iterative reconstruction, LAMA = low attenuation muscle area, LD-kVp = low dose with reduced voltage, LD-mAs = low dose with reduced current, NAMA = normal attenuation muscle area, SMA = skeletal muscle area, STD = standard dose

