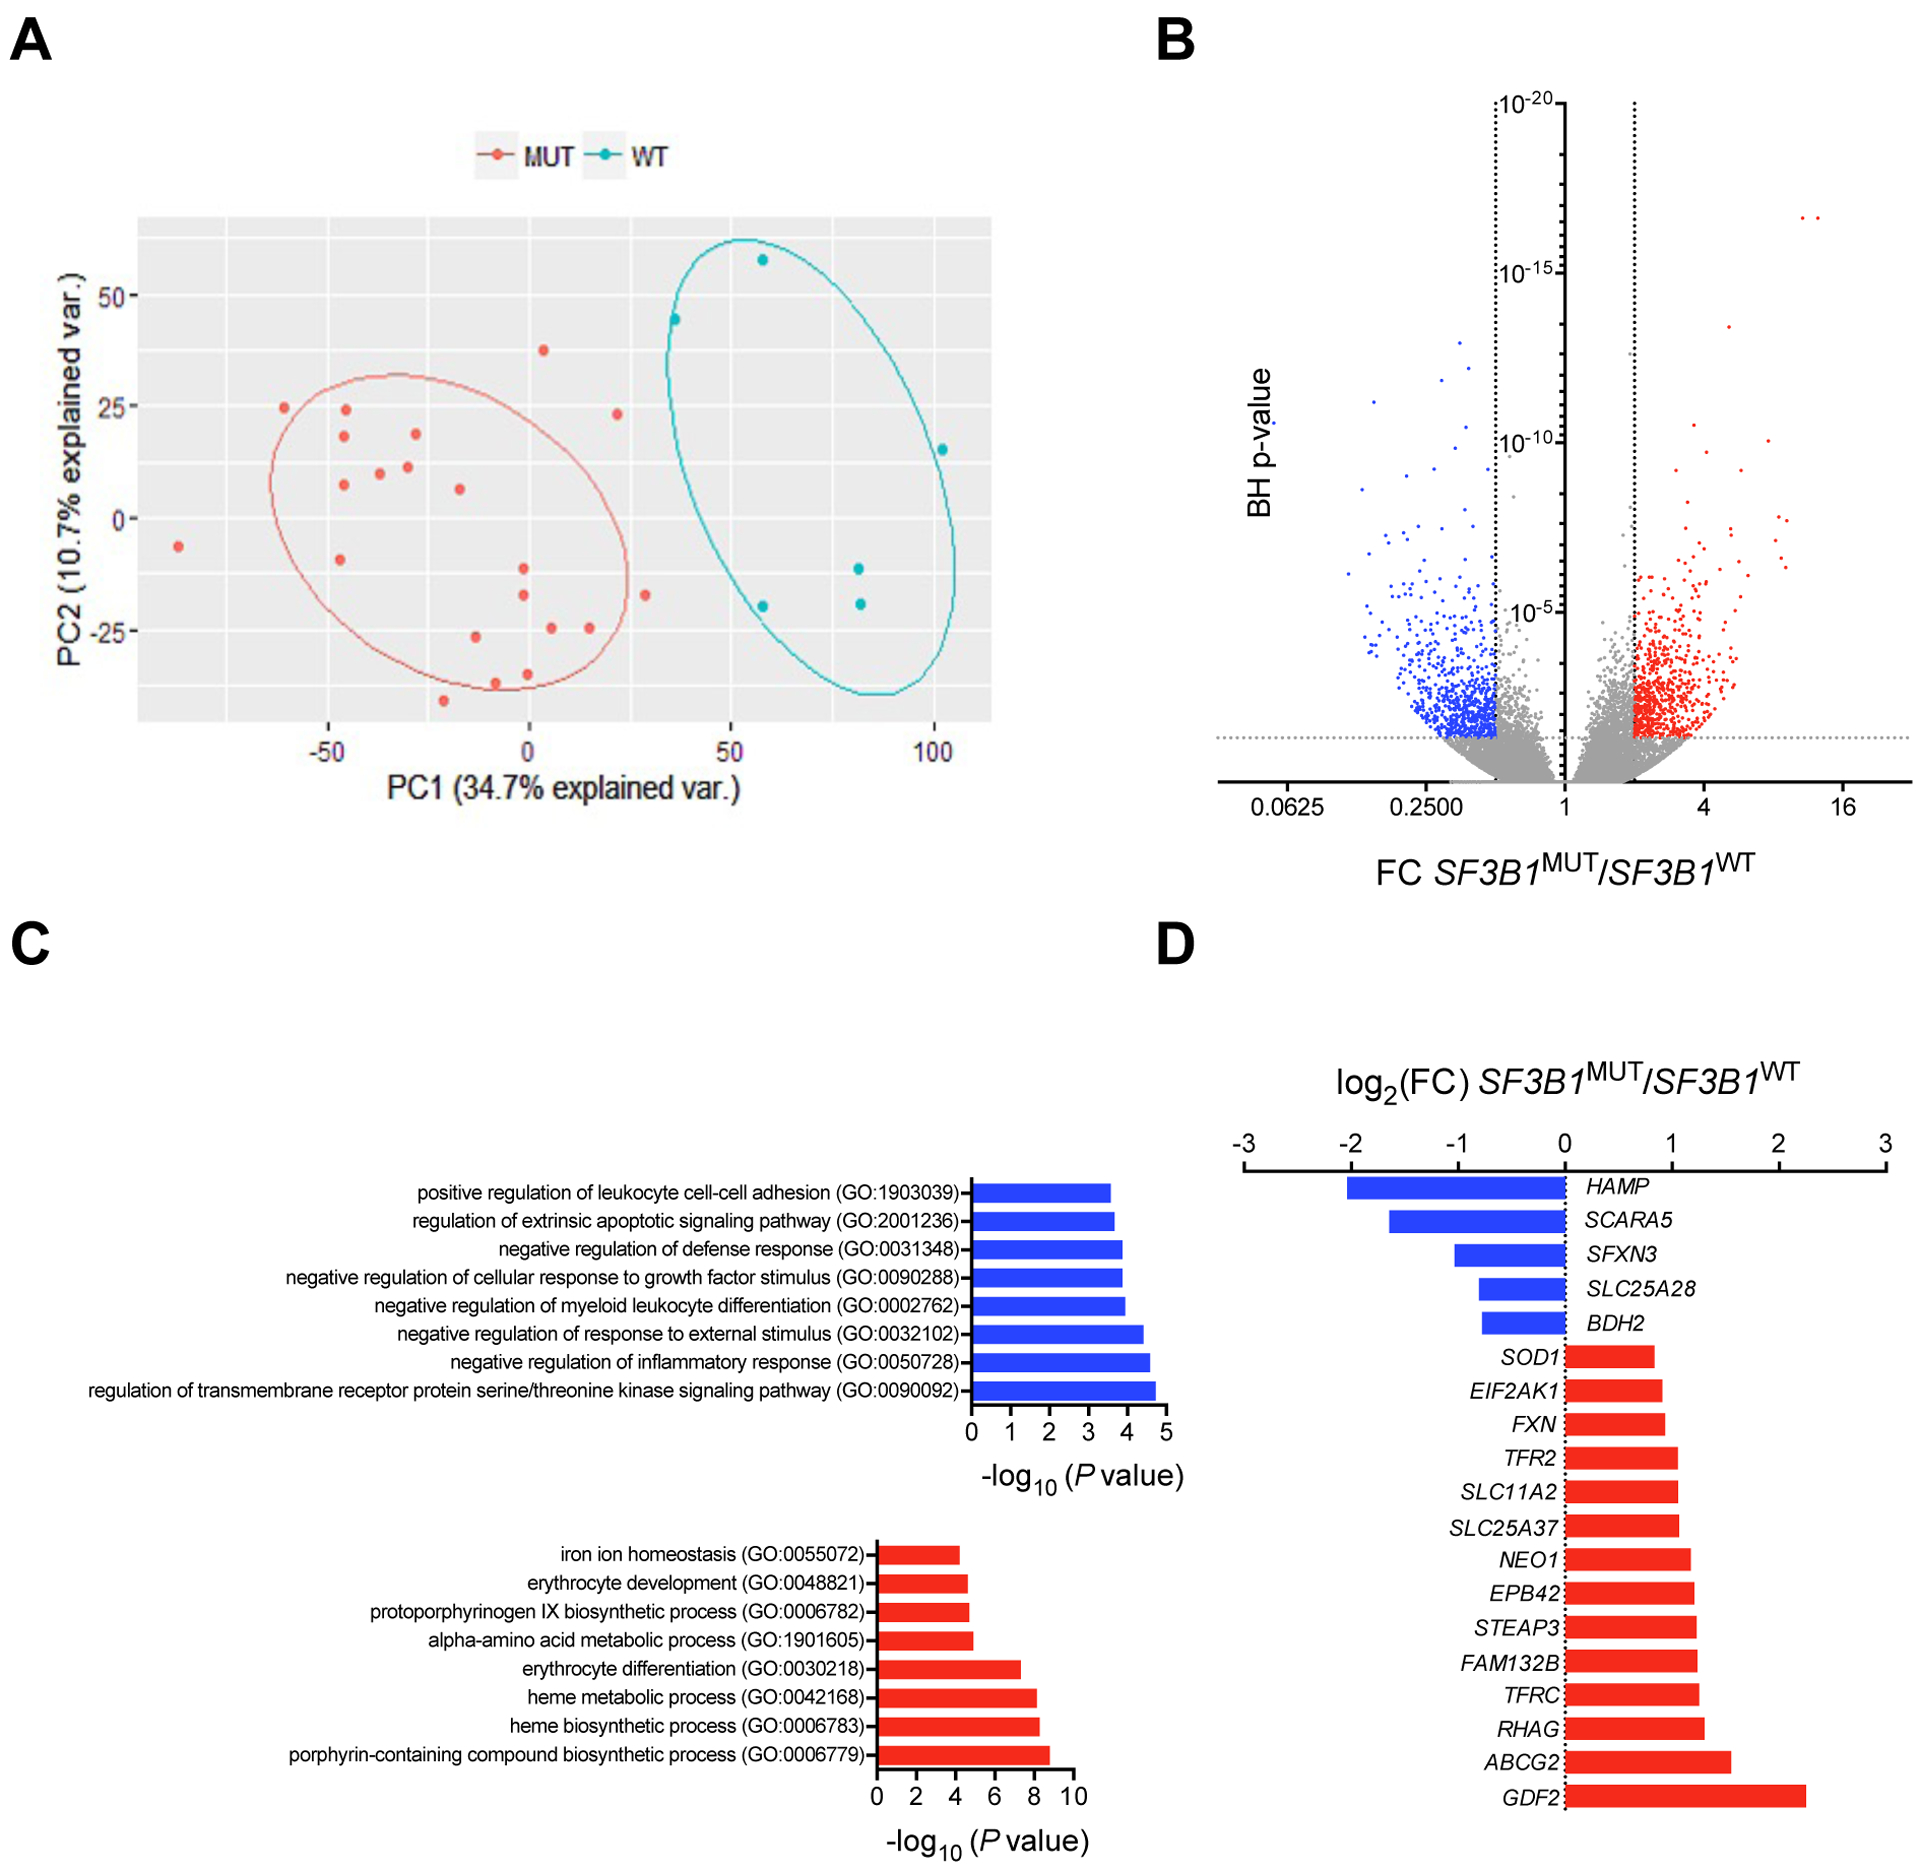
Fig. 1: Differential gene expression in SF3B1MUT MDSs.

(A) Bi-plot of the first 2 principal components (PCs) showing 45.4% of the variability within the data (PC1, x-axis; PC2, y-axis). (B) Volcano plot showing differentially expressed transcripts in SF3B1MUT BM MNCs compared to SF3B1WT BM MNCs. Fold change (FC) on x-axis and negative log10 of Benjamini-Hochberg (BH) corrected P-values on y-axis. Dashed vertical and horizontal lines reflect the filtering criteria (FC <0.5 or >2.0 and BH-corrected P-value <0.05). The red dots represent differentially up-regulated transcripts, the blue dots represent differentially down-regulated transcripts, and the gray dots represent transcripts without differential expression. (C) GO enrichment analysis of differentially expressed genes with an absolute log2 (FC) >1 and a P-value <0.05 in SF3B1MUT MDS. The most down-regulated and up-regulated gene sets are represented. (D) Log2(FC) of the expression of 16 among the 96 genes of the IRON_ION_HOMEOSTASIS gene set (GO:005072) deregulated in SF3B1MUT MDS.
