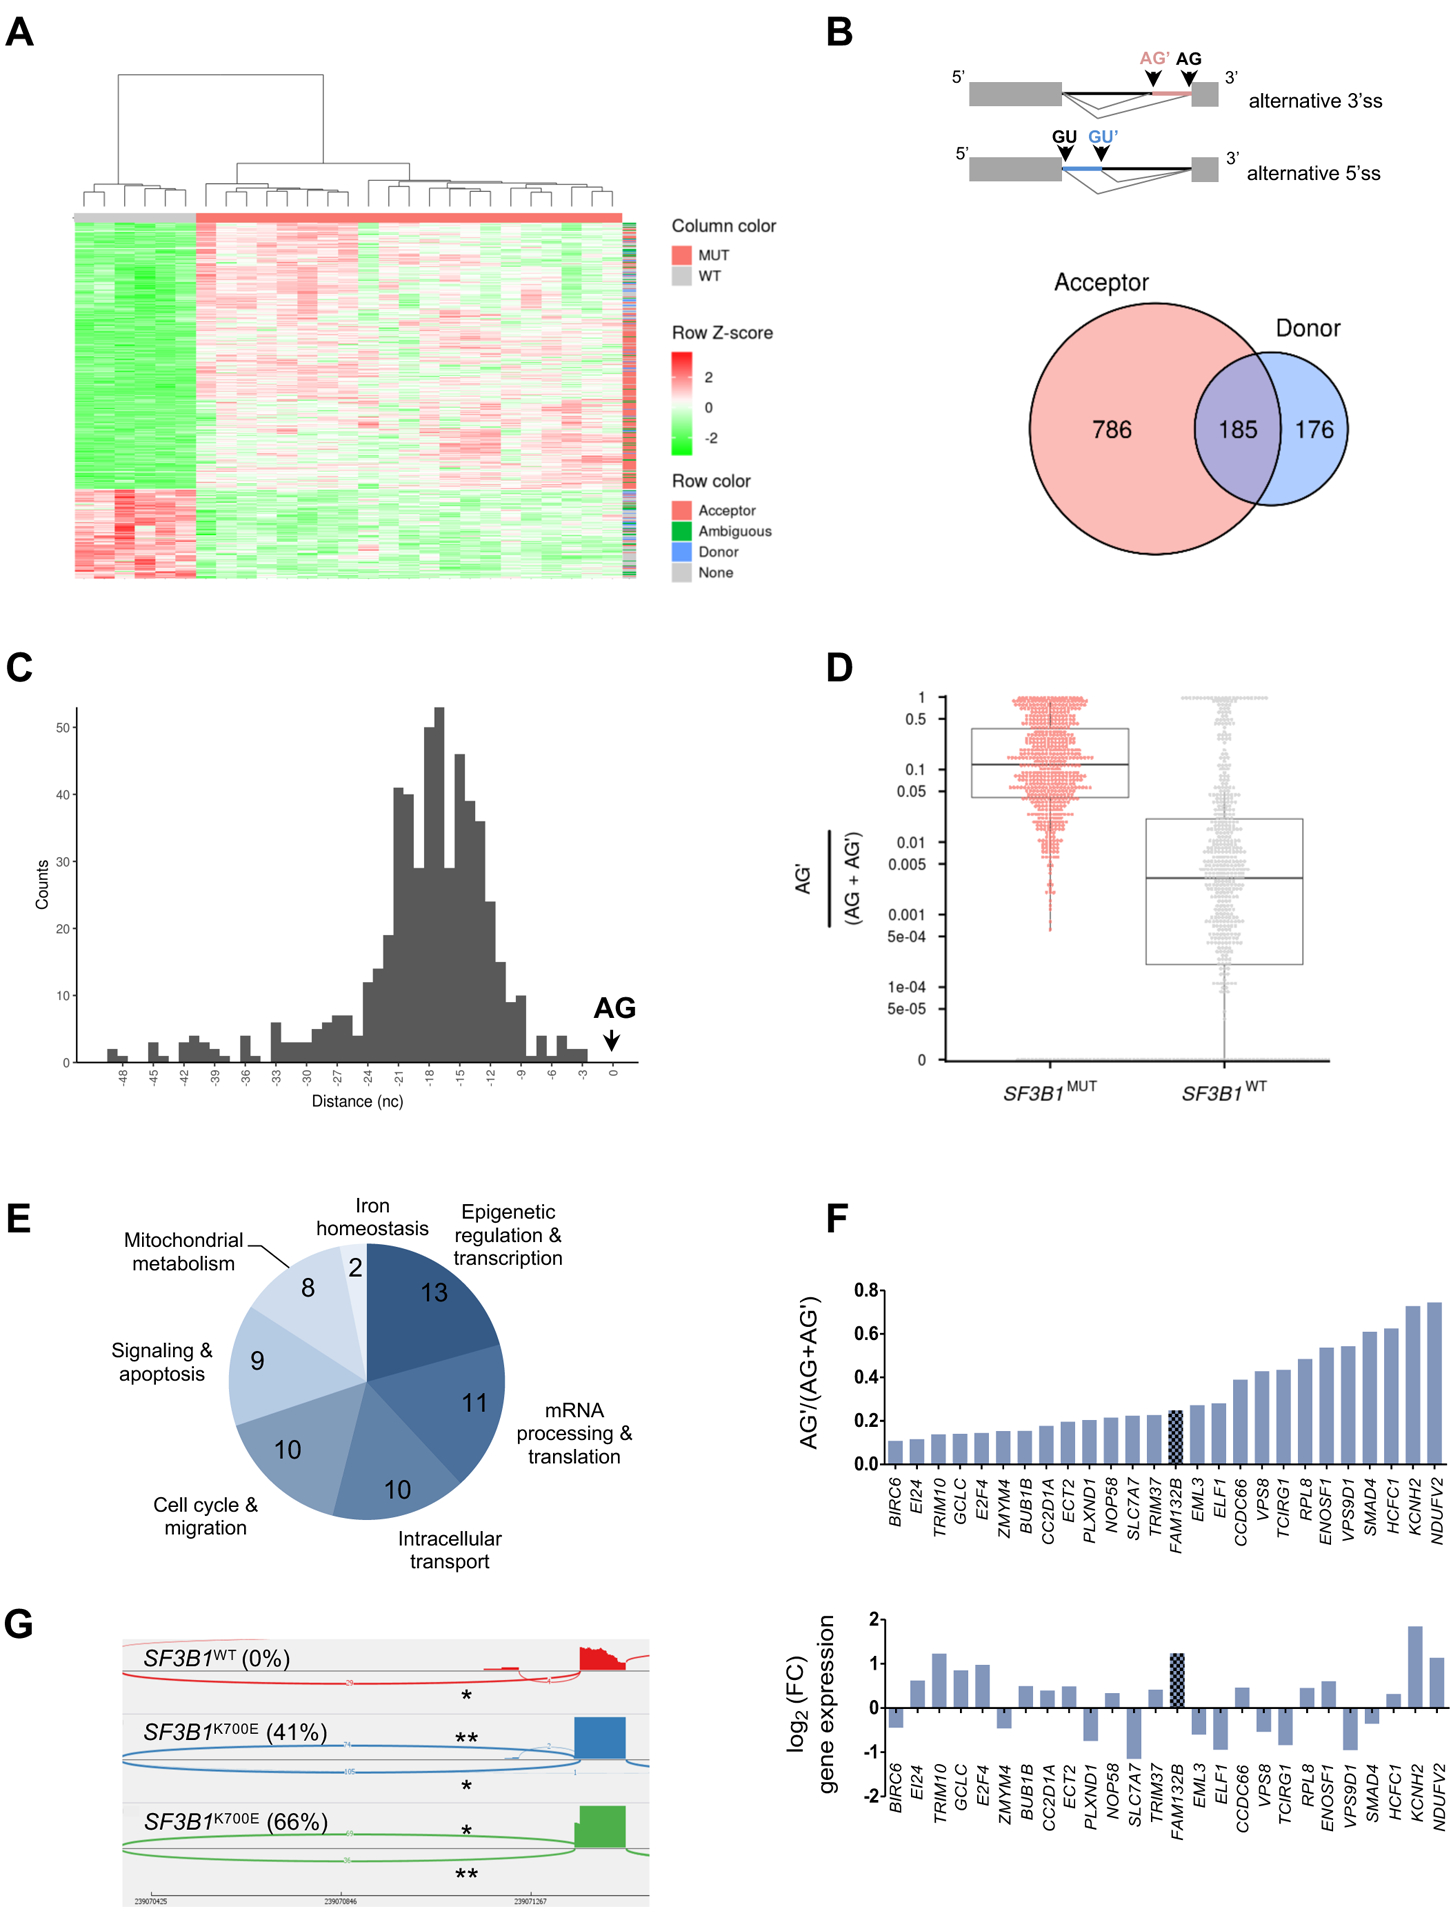
Fig. 2: Differential splice junctions in SF3B1MUT MDSs.

(A) Hierarchical clustering and heat-map of differential splice junctions between SF3B1MUT and SF3B1WT MDS samples. Values indicating percent usage of the differential splice junction versus all other junctions sharing the same splice site are normalized as Z scores across patients and limited to a maximum of |Z| = 2. Rows are splice junctions with indicated types: acceptor (red), donor (blue), ambiguous (green), and differentially expressed canonical junction (gray). Columns are patients. (B) Venn diagram of the number of differential alternative 5’ donor and 3’ acceptor junctions in SF3B1MUT compared to SF3B1WT MDS. The overlapping area represents ambiguous junctions (n = 185). (C) Distances between the alternative (AG’) and canonical (AG) 3’splice sites within the 50 nucleotides upstream of the AG plotted as a histogram. (D) Comparison of the expression of alternative junctions. The ratio AG’/AG’+AG for each junction in SF3B1MUT (red) versus SF3B1WT (gray) MDS is shown. (E) Distribution of the biological functions of 63 genes affected by one or two aberrant 3’ss junctions located at <50 bases of the canonical 3’ss, an additional sequence multiple of 3 nucleotides, a ratio AG’/(AG’+AG) >0.1 in SF3B1MUT samples, and a FC >10. (F) Ratio of AG’/(AG’+AG) in 26 genes whose expression was up- or down-regulated in SF3B1MUT patients. (G) Sashimi plot of 3’ss canonical (*) and aberrant (**) junctions in FAM132B/ERFE gene in three BM MNC samples, 1 SF3B1WT and 2 SF3B1K700E MDS. The ratio AG’/(AG’+AG) is indicated in parentheses.
