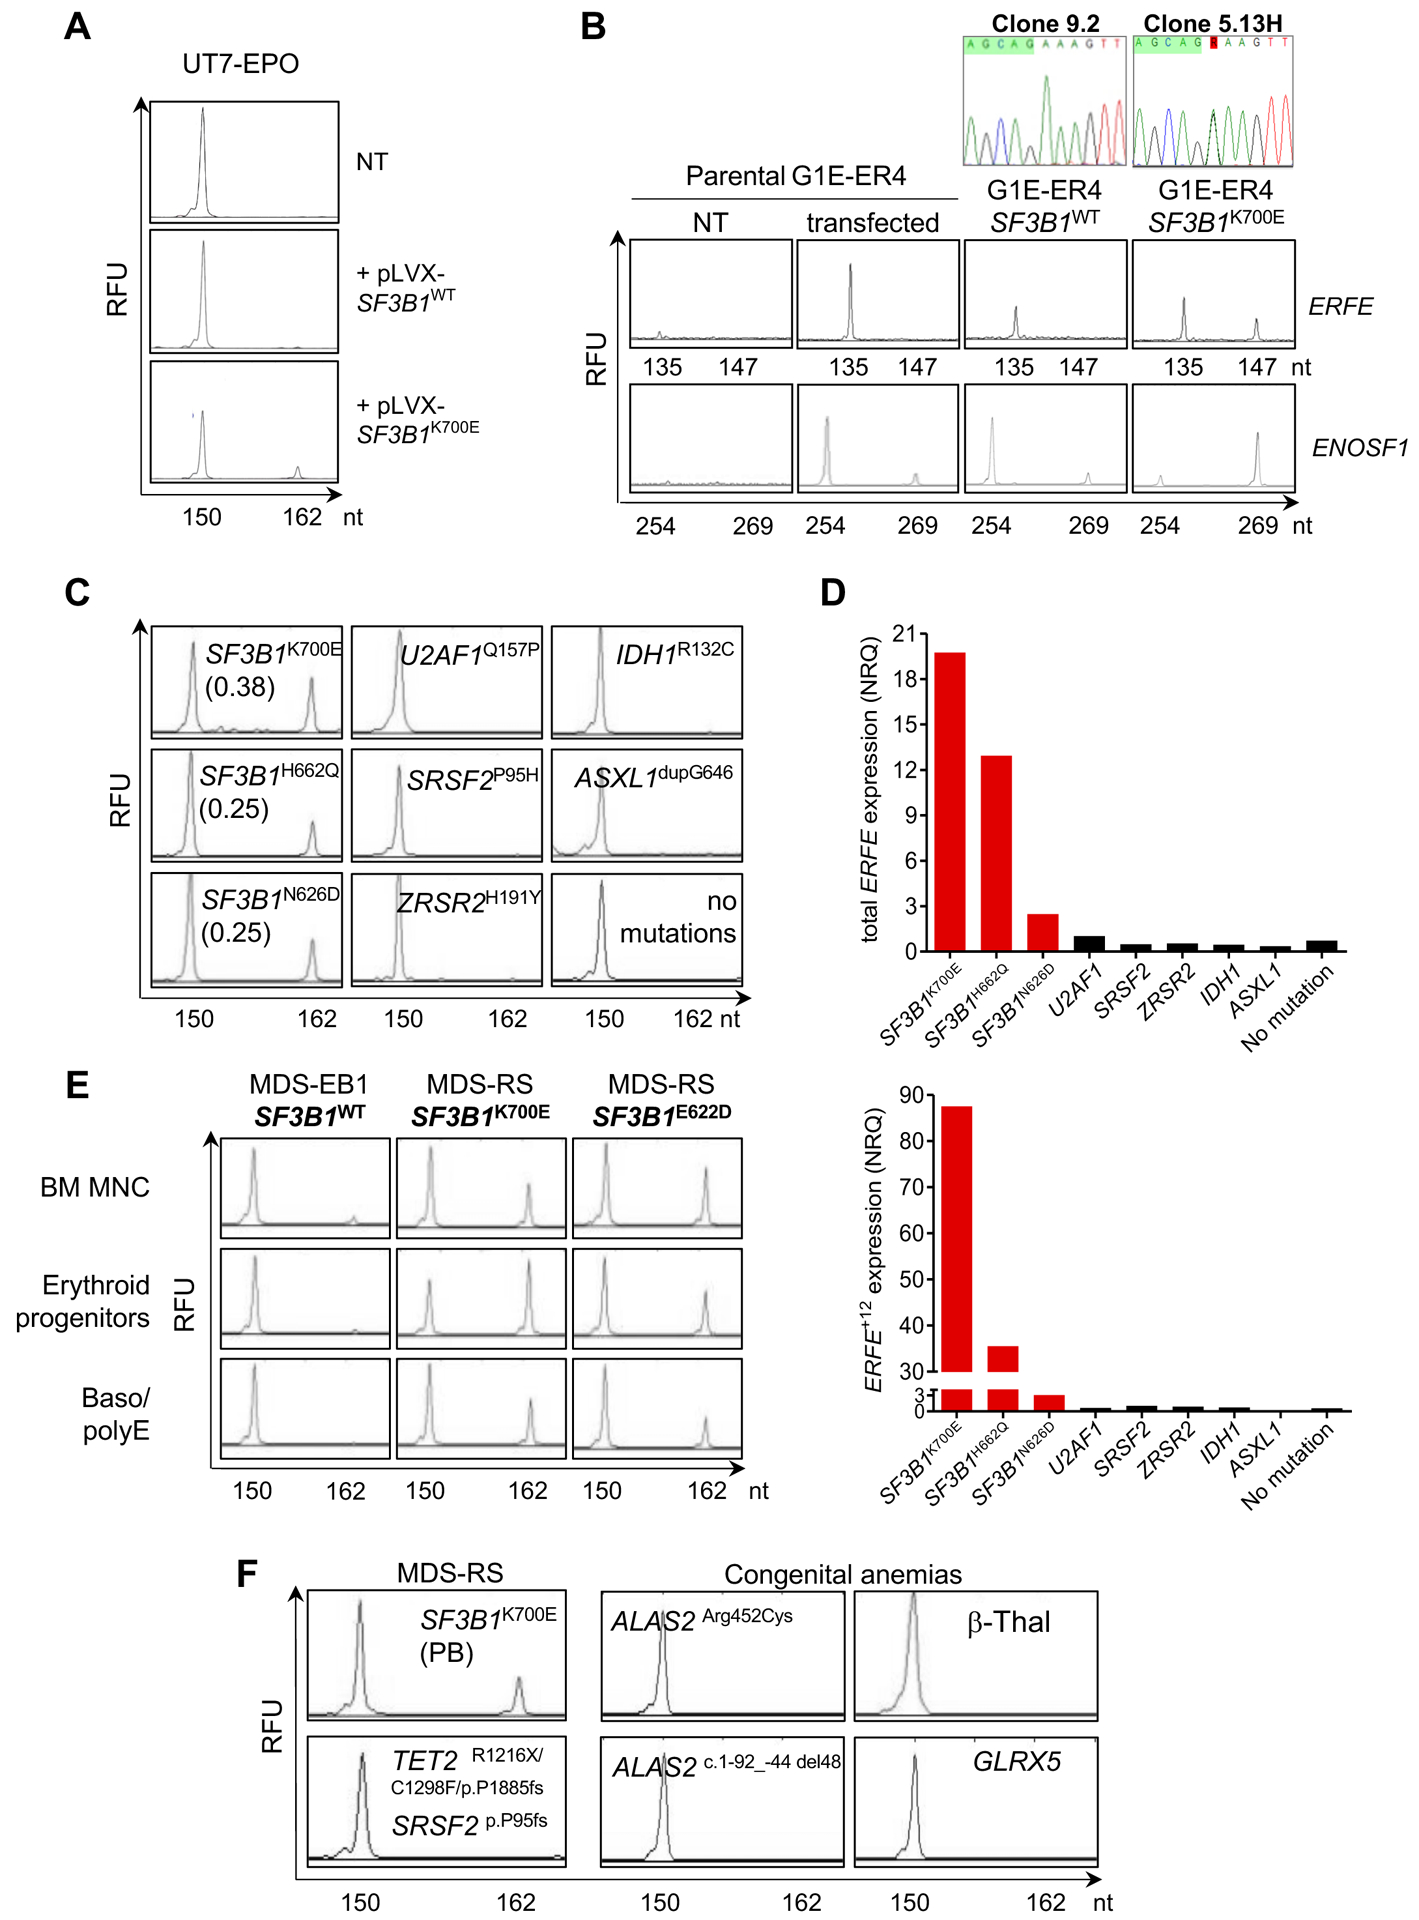
Fig. 3: SF3B1-dependent expression of 3’ss aberrant ERFE+12.

(A) Induction of ERFE+12 by expressing SF3B1K700E in human SF3B1WT UT-7/EPO cell line. Cells were transfected with a pLVX plasmid encoding a synthetic SF3B1WT or SF3B1K700E cDNA. Non-transfected (NT) UT-7/EPO cells are shown as a control. The canonical ERFE and aberrant ERFE+12 transcripts were detected by capillary electrophoresis of fluorescent PCR products. The x-axis represents molecular size (nt for nucleotides) of PCR amplicons, and the y-axis represents relative fluorescent units (RFU). The peak at 150 nt corresponds to the canonical transcript, whereas the peak at 162 nt refers to the alternative transcript due to cryptic AG’ usage. (B) Analysis of alternative AG’ and canonical AG usage of ERFE and ENOSF1 minigenes transfected into murine CRISPR-Cas9 SF3B1WT (clone 9.2) and SF3B1K700E (clone 5.13H) G1E-ER4 cells by fluorescent PCR. Transfected and NT parental G1E-ER4 cells are shown as controls. The peak at 135 nt corresponds to the transcript generated by a canonical AG usage, whereas the peak at 147 nt refers to the alternative transcript due to cryptic AG’ usage. (C) Detection of ERFE+12 depends on the presence of a SF3B1 mutant in MDS. BM MNC RNAs from 3 patients with SF3B1 mutations (SF3B1K700E, SF3B1H622Q, SF3B1N626D), 3 with mutations in other splice genes (U2AF1Q157P, SRSF2P95H, ZRSR2H191Y), and 3 with IDH1R132C, ASXL1dupG646 or no mutations were analyzed. ERFE+12/ERFE+12+ERFEWT ratios are indicated. (D) Quantification of ERFEWT and ERFE+12 transcripts by RT-qPCR in BM samples depicted in (C). Results are expressed as normalized ratio quantities (NRQ) to ACTB and B2M housekeeping genes. (E) Detection of ERFEWT and ERFE+12 transcripts in SF3B1MUT or SF3B1WT erythroid progenitors or basophilic/polychromatic erythroblasts (Baso/polyE) in culture in comparison with BM MNC. (F) Analysis of ERFE transcripts in SF3B1WT diseases with ineffective erythropoiesis. The image shows peripheral blood (PB) MNC from 1 patient with MDS-RS with TET2, SRSF2 and no SF3B1 mutations, samples from 3 patients with congenital sideroblastic anemias (2 BM samples with ALAS2 mutation and 1 PB sample with GLRX5 mutation) and one PB sample from a patient with severe β-thalassemia (β-Thal). Samples were analyzed by capillary electrophoresis of ERFE PCR products. One PB sample from a SF3B1K700E MDS patient was used as a positive control.
